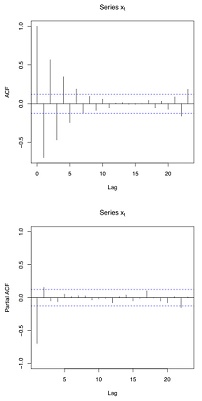
Problem 1: The graphs below show the sample autocorrelations and sample partial autocor-relations of an observed time series, {xt}. Based on these graphs, what models would you consider for {xt}? Which model would be your first choice? (Justify your answers concisely.)

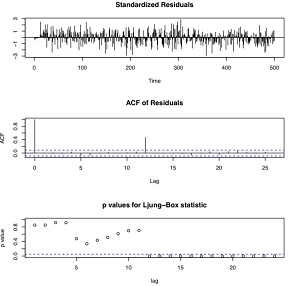
Problem 2: A seasonal ARIMA model was fitted to a monthly time series. A summary of the fitted model and some residual diagnostics are given below.
Write down the mathematical equation of the fitted model in operator form. Is there evidence that the model is not- adequate? If so, suggest a modification of the model that may lead to a better fit.
Call:
arima(x = y. order = c(2. 1, 1), seasonal = list(order c(0, 1, 0), period 12)
Coefficients:
ar1 ar2 mal
0.8498 -0.4475 0.5438
s.e. 0.0508 0.0482 0.0466
sigma-2 estimated as 1.582: log likelihood = -803.8, aic = 1615.61
