1. The graph on the right below is reproduced from a book on statistical graphics written by a group of Swedish Government statisticians.
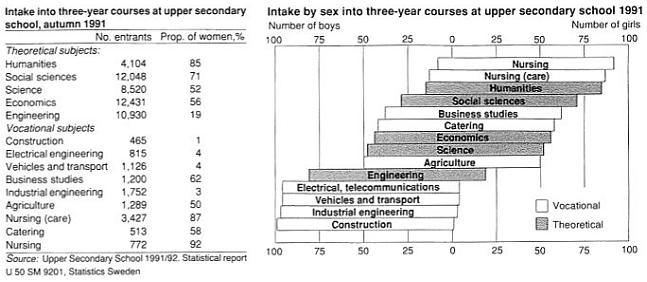
Write an R function that can be used to produce this kind of graph. (The function needs to be general purpose, but you can show that it works on this particular data set.)
It is important that you make the function exible by providing optional arguments that control how the function behaves. Labelling and colour are obvious optional arguments. (Don't try to provide every kind of capability. Concentrate on implementing a few options well.)
One of the most important parts of this assignment is the presentation of the code. Be sure that you read what is expected on the class website.
Hints
(a) The data for the example is on the class website (look under the Assignments link).
(b) The graph can be produced using basic R graphics, but a version done using layout provides more control.
(c) You may �nd that the order function is useful when reordering the data.
Attachment:- assn2.txt