Assignment Problem:
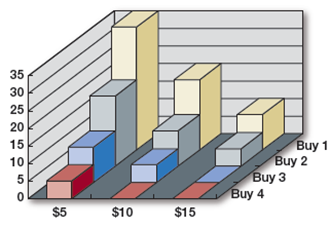
The Figure below depicts data sampled from patrons of a local upscale restaurant responding to survey questions about the fees proposed for a newly opening pop. The pop plans to offer drink glasses during which customers would sample triplets of drinks. The pop hopes to charge a cover fees (like the fees pop visitors pay for live music). The entrance fees is the first tariff and the glasses of drink that the customer

|
|
Total
|
|
Number of visits sold
|
|
Price
|
1
|
2
|
3
|
4
|
|
$5
|
35
|
20
|
10
|
5
|
|
$10
|
20
|
10
|
5
|
0
|
|
$15
|
10
|
5
|
0
|
0
|
Drinks comprise the second part of the price structure. When customers were asked of their intentions to visit the pop, 35 respondents said they would go to the pop once in a month if the cover charge was $ 5, and slightly 20 respondents said they would go twice if the entrance was priced at $ 5, while 10 respondents said they would once a month if the cover charge was as high as $ 15, and no one said they would go four times (once a week) if the price was that steep (high). The table above depicts these responses at different levels of entrance fees.6
Weight the number of sales by the profitability given that the variable unit cost is $2. Which entrance price is more profitable to the new pop?