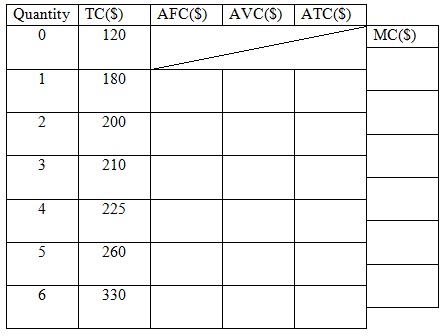
Problem 1. Suppose that you have the information shown in the table about a firm’s costs.

(Note)
TC: Total cost
AFC: Average fixed cost
ATC: Average total cost
MC: Marginal cost.
a. What is the firm’s total fixed cost?
b. Complete the missing data in the table. What is the firm’s minimum-cost output?
c. On one diagram, draw the firm’s average total cost (ATC), average variable cost (AVC), and marginal cost (MC) curves.
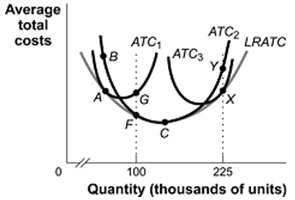
Problem 2. The graph below shows three average total cost (ATC) curves associated with alternative scales of plant that a firm can build. The LRATC curve shows the firm's long-run average total cost curve.

a. Indicate at what point on its LRATC curve the firm is operating the optimum scale of plant at its optimum rate of output.
b. Choose the correct answer:
1) If the firm expected to produce 100-thousand units of the good in the long run, the firm should build a plant associated with ATC1/ ATC2 / ATC3 .
2) If the firm currently was producing at point C on the ATC2 in the accompanying figure, but anticipates increasing output to 225-thousand units in the long run, the firm will build a smaller/larger plant and experience economies of scale/diseconomies of scale.
3. The total short-run cost function of a firm is given by the equation C=190+53Q, where C is the total cost and Q is the total quantity of output.
a. What is the firm’s fixed cost?
b. If the firm produces 100 units, what is its average cost and average variable cost?
c. What is its marginal cost per unit produced if the firm is currently producing 100 units and decides to produce an additional unit?
d. Suppose that the firm’s fixed cost rises by $50, but its marginal cost falls to $45 per unit. Write the new cost equation.