Discussion:
Q: A national sales manager of an automobile supply chain claims that monthly sales of auto parts at on of the district office are an average of $5,285. The district manager believes the amount is too high. They authorize you to settle the dispute. You take a simple random sample (n=25) of the sales receipts over the last three years. Upon reviewing the sales receipts, you determine that the mean sales are $4,720 with a standard deviation of $350. Test the national managers claim that the mean is actually less than $5,285 or more versus the district managers claim that the mean is actually less than $5,285. You may assume a=0.05 and the population is symmetric and mounded.
a) H0: Ha:
b)What is the critical value of the test statistic?
c)What is the calculated value of the test statistic?
d)What is the p-value of the test statistic?
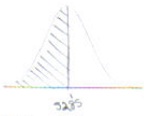
e)Make a diagram and shade the rejection region(s)
f) State and support your decision about the null hypothesis
g)Construct a 95% confidence interval for the mean cost of the supplies.
h)What would you tell the national and district managers about their dispute?