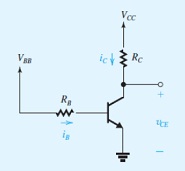
Response to the following problem:
The purpose of this problem is to illustrate the application of graphical analysis to the circuit shown in Figure. Sketch iC -vCE characteristic curves for the BJT for iB = 10 μA, 20 μA, 30 μA, and 40 μA. Assume the lines to be horizontal (i.e., neglect the Early effect), and let β=100. For VCC = 5 V and RC = 1 kΩ , sketch the load line. What peak-to-peak collector voltage swing will result for iB varying

Over the range 10 μA to 40 μA? If the BJT is biased at VCE = 1 2VCC, find the value of IC and IB. If at this current VBE = 0.7 V and if RB = 100 kΩ , find the required value of VBB.