Problem 1. In Naked Economics in Chapter Wheelan discusses "human capital". In your own words what is human capital? What are you doing to alter your own human capital: be specific about the skills and specifics of what you are doing? How does going to college alter human capital? How is it altering your human capital?
Problem 2. In Naked Economics in Chapter Wheelan discusses some basic ideas with regard to personal investing. After reading the chapter, did you learn anything you did not already know? Specify what you learned and why you found this interesting. Try to specify at least three items in your essay. In this course we have talked a bit about saving for retirement and now Wheelan addresses some basic ideas about personal investing: these ideas are, of course, related. What have you learned from this classroom discussion as well as the readings you have done this semester? Do you have new ideas as well as new questions after our study of these topics? (Don't worry-having new questions is actually a really good sign! Means you are thinking...and there is no teacher that does not celebrate that!)
Problem 3. In Naked Economics in Chapter 8 Wheelan writes citing Gary Becker's work on page 179 "When it comes to interest group politics, it pays to be small." Explain this quote in your own words. Can you provide at least two current examples of small interest groups that seem to be benefitting politically? Identify the group and then explain what you think is happening politically to that group. You might find it helpful to read a few days of The New York Times before you answer this question.
Problem 4. In Naked Economics in Chapter 9 Wheelan writes GDP. Provide a brief summary of how real GDP is not a complete measure of how an economy is doing.
Problem 5. In Naked Economics in Chapter Wheelan writes on page 199 the research suggests that people have greatest happiness from "experiences over commodities, pastimes over knick-knacks, doing over having." Write a short essay on your own experience with regard to your choices and your happiness. Be thoughtful now!
Problem 6. This is a series of questions on GDP measurement.
a. Susie takes care of Rachel's children and earns $30,000 a year that she reports on her income taxes. Rachel works as a tutor for neighborhood students and earns $20,000 a year in cash that she does not report on her taxes. Robert runs a car repair shop and earns $60,000 a year and reports to the Internal Revenue Service that his business earned $40,000: the other $20,000 is money he earned but kept no record of.
What is the annual contribution to GDP given this information? Be specific in your answer.
b. Michael runs Heirloom Repairs and recently repaired a desk built in 1875. The value of the desk in the antiques market is $1200 and Michael's repair bill was $235. Susie recently purchased a quilt sewn in 1948 for $125 and sold 10 pillows made from this quilt for $40 per pillow. Assume that both Michael and Susie comply with all income tax reporting requirements for these activities. What is the contribution to GDP from these activities? Be specific in your answer.
c. Harriet runs a drug ring out of her house and this year she earned $235,000 from her drug operation. Finley manufactures tires and this year he produced 5000 tires that were valued at $100 per tire. Of these 5000 tires, 3200 went on new cars while the rest were sold to tire dealerships where they eventually found their way to old cars that needed replacement tires. What was the contribution to GDP from these activities? Be specific in your answers.
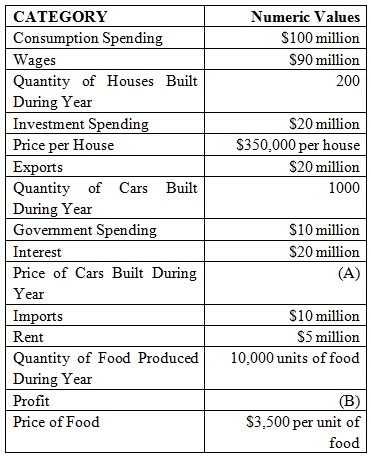
Problem 7. Consider the economy of Parland. Parland produces three goods: houses, cars, and food (measured as units of food). Parland is an open economy that trades with other countries. You are given the following, rather jumbled, set of information about Parland's economy for 2014.

a. Given the above information, calculate the value of GDP. Show your work. Identify the method you are using to do this calculation.
b. Calculate the value of (A), the price of cars. Show your work.
c. Calculate the value of (B), the level of profits. Show your work.
Problem 8. Consider an economy that has 1000 people. Of these 1000 people 200 are children that are less than 16 years old, 100 are retired but who are all under age 65, 50 are full-time students over age 16 that are not seeking work, and 100 are homemakers who are not actively seeking work outside the home. In addition, there are 100 people who are currently not working, available to work, and actively applying for jobs every week. The economy also has 300 people who are working full-time; 50 people who are working part-time but who would prefer to work full-time and are seeking full-time employment; and 50 people who are happily working part-time. Any other people not accounted for are discouraged workers who have been unemployed for some time and have given up actively seeking employment since they believe there are no jobs available for them.
a. Given the above information what is the size of the labor force? Show how you calculated the value of this number.
b. What is the labor force participation rate? Show your work.
c. What is the unemployment rate? Show your work.
d. Suppose that the government of this economy decides to start counting people who have given up the job search due to discouragement as unemployed people. How will this decision affect the number of unemployed, the number in the labor force, and the unemployment rate? Show your work.
e. Suppose that the definition of unemployed is changed to include discouraged workers as well as part-time workers who want to work full-time but who have not secured full-time jobs. Recalculate the number of unemployed, the number in the labor force, and the new unemployment rate using this new definition. Show your work.
f. Does the definition of who is unemployed make a difference with regard to the numerical value of the unemployment rate? Explain your answer.
Problem 9. You are given the following information about the economy of Macroland.

a. Using the above information calculate nominal GDP for 2012, 2013, and 2014 in Macroland. Provide any formulas that you use and show your work. Consolidate your answers in the following table:

b. Using the above information calculate real GDP for 2012, 2013, and 2014 in Macroland using 2012 as the base year. Provide any formulas that you use and show your work. Consolidate your answers in the following table.
c. Compute the GDP deflator for 2012, 2013, and 2014 using 2012 as the base year and a l00 point scale. Show any formulas you use. Use a calculator for these calculations and round your answer to the nearest hundredth. Consolidate your answers in the table below.

d. Using the GDP Deflator you calculated in (c), calculate the rate of inflation between 2012 and 2013 and between 2013 and 2014. Show any formulas you use and provide your work. Use a calculator and round your answer to the nearest hundredth. Consolidate your answers in the following table. If you get a negative percentage this indicates that there was deflation in this economy.
Period of Time Rate of Inflation
2012-2013
2013-2014
e. Suppose that the market basket for purposes of computing the CPI in this economy is given as 10 bikes, 5 sweaters, 5 sandwiches, and 10 books. Compute the cost of the market basket for 2012, 2013 and 2014. Provide any formulas you use and consolidate your answers in the following table.
Year Cost of Market Basket
2012
2013
2014
f. Using the values you calculated in (e), construct the CPI using 2014 as your base year and a 100 point scale. Show any formulas you use and round your answer to the nearest hundredth. Consolidate your answers in the table below.
Year CPI with base year 2014
on a 100 point scale
2012
2013
2014
g. Using the CPI values you calculated in (f), compute the rate of inflation between 2012 and 2013 and between 2013 and 2014. Show your work. Use a calculator and round your answers to the nearest hundredth. Consolidate your answers in the following table.
Period of Time Rate of Inflation
2012-2013
2013-2014
h. Compare the rates of inflation you got in (d) with the rates of inflation you got in (g). Are they the same? Would you expect them to be the same?
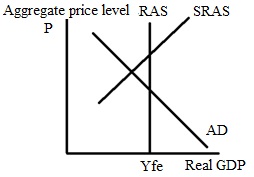
Problem 10: Use the aggregate demand/aggregate supply (AD/AS) model as discussed in class to answer this set of questions.
a. The graph below depicts the short-run situation for an economy where AD is the aggregate demand curve, SRAS is the short-run aggregate supply curve, LRAS is the long-run aggregate supply curve, and Yfe is potential GDP or full employment GDP.

i. On the graph, label the short-run level of real GDP as Y1. Label the short-run aggregate price level as P1.
ii. Based upon the graph, describe how the economy is performing in the short-run. Be sure in your answer to comment on the level of production in the short-run, and the level of unemployment in the short-run.
iii. In the long-run if there is no fiscal or monetary policy intervention into this economy, what do you predict will happen? Make sure you identify if any curves are shifting and if they are shifting, identify the direction of that shift. Also, in your answer write about what will happen to the level of real GDP in the long run and what will happen to the unemployment rate in the long run. Draw a graph to illustrate this long-run adjustment.
iv. Suppose that the government decides that the short-run situation is worthy of government intervention in the form of fiscal policy. What kind of fiscal policy is the government likely to engage in given the short-run situation that is presented in the graph? How will this fiscal policy affect the economy according to this model?
v. Suppose that the government decides that the short-run situation is worthy of government intervention in the form of monetary policy. What kind of monetary policy is the central bank likely to engage in given the short-run situation that is presented in the graph? How will this monetary policy affect the economy according to this model?
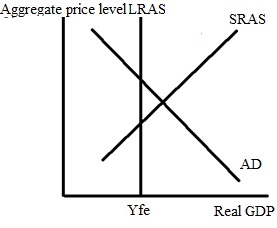
b. The graph below depicts the short-run situation for an economy where AD is the aggregate demand curve, SRAS is the short-run aggregate supply curve, LRAS is the long-run aggregate supply curve, and Yfe is potential GDP or full employment GDP.

i. On the graph, label the short-run level of real GDP as Y1. Label the short-run aggregate price level as P1.
ii. Based upon the graph, describe how the economy is performing in the short-run. Be sure in your answer to comment on the level of production in the short-run, and the level of unemployment in the short-run.
iii. In the long-run if there is no fiscal or monetary policy intervention into this economy, what do you predict will happen? Make sure you identify if any curves are shifting and if they are shifting, identify the direction of that shift. Also, in your answer write about what will happen to the level of real GDP in the long run and what will happen to the unemployment rate in the long run. Draw a graph to illustrate this long-run adjustment.
iv. Suppose that the government decides that the short-run situation is worthy of government intervention in the form of fiscal policy. What kind of fiscal policy is the government likely to engage in given the short-run situation that is presented in the graph? How will this fiscal policy affect the economy according to this model?
v. Suppose that the government decides that the short-run situation is worthy of government intervention in the form of monetary policy. What kind of monetary policy is the central bank likely to engage in given the short-run situation that is presented in the graph? How will this monetary policy affect the economy according to this model?
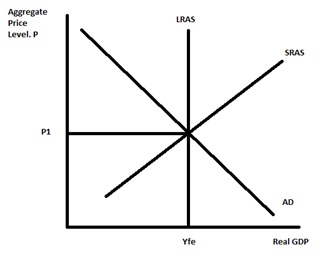
c. Consider the economy that is represented in the figure below. This economy is currently in long run equilibrium producing Yfe at an aggregate price level of P1.

Suppose that there is a negative supply shock that results in oil prices increasing.
i. Draw a graph that depicts the short-run effect of this negative supply shock; in your graph indicate the new aggregate price level as P2 and the new level of real GDP as Y2. Verbally describe the short-run economy making note of whether the economy is in a boom or a recession, what you know about the direction of prices, and what you know about the unemployment rate.
ii. Given the negative supply shock, describe the impact of expansionary fiscal policy on this economy. Make sure your answer describes any shifts of curves in the AD/AS model; the impact on the aggregate price level and the impact on the level of real GDP. Are there any negative impacts from the government of this economy pursuing expansionary fiscal policy?
iii. Given the negative supply shock, describe the impact of contractionary fiscal policy on this economy. Make sure your answer describes any shifts of curves in the AD/AS model; the impact on the aggregate price level and the impact on the level of real GDP.
Why would the government consider implementing contractionary fiscal policy as a remedy for this negative supply shock?
iv. Given the negative supply shock, describe the impact of expansionary monetary policy on this economy. Make sure your answer describes any shifts of curves in the AD/AS model; the impact on the aggregate price level and the impact on the level of real GDP. Are there any negative impacts from the central bank of this economy pursuing expansionary monetary policy?
v. Given the negative supply shock, describe the impact of contractionary monetary policy on this economy. Make sure your answer describes any shifts of curves in the AD/AS model; the impact on the aggregate price level and the impact on the level of real GDP. Why would the central bank consider implementing contractionary monetary policy as a remedy for this negative supply shock?
Problem 11.
a. Suppose that Tim invests $2,000 in a financial asset that pays a constant 7% a year. Provide a number line that illustrates how this investment will grow over time starting at year 0 and ending at year 70.
b. Suppose that Jane invests $5,000 in an investment that earns 5% a year over time. Provide a number line that illustrates how this investment will grow over time starting at year 0 and ending at year 70.
c. Henry is trying to decide whether to invest in the same financial instrument as Tim or the same financial instrument as Jane. He would make exactly the same investment as Tim or Jane and his only concern is the value of this investment 40 years from today. What would you recommend?