Assignment:
Question 1
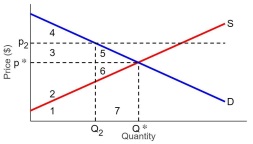
Use the below Supply and Demand lines, and areas indicate to answer the questions.

A) What is "consumer surplus" and what numbered area(s) make up the consumer surplus above?
B) What is "supplier surplus" and what numbered area(s) make up the supplier surplus above?
C) What is "economic surplus" and what numbered area(s) make up the economic surplus above?
D) Now suppose there is a quota in the market at Q2. What is economic the loss called? What numbered area(s) make up this loss?
Question 2
Both diagrams below show the income and substitution effects of a rise in price from P0 to P1. In each case the substitution effect is illustrated by the change in quantity demanded from Q0 to Q* the income effect is illustrated by the change in quantity demanded from Q* to Q1

A) Is Good X a normal or an inferior good? Explain how you know this in terms of Real Income.
B) Is Good Y a normal or an inferior good? Explain how you know this in terms of Real Income.
C) For each of Goods X and Y, explain whether the income effect is working in the same direction or the opposite direction as the substitution effect.
Questions 3

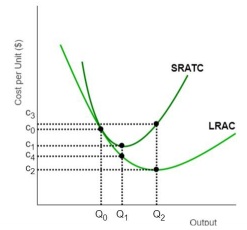
Consider the diagram at the right of SRATC and LRAC curves. The SRATC curve is drawn for a given plant size.
A) Given the plant size associated with SRATC, what is level of output which minimizes average cost in the short run? And at what cost is this? (use the notation from the graph)
B) Suppose in the short-run the firm wants to increase output to Q2 - what would the cost would be associated with this? And how could this increased output be attained? (in terms of factors of production)
C) After the company has invested in a bigger plant, in the long run, why are they able to produce at a cheaper average cost? (looking for a specific term)
D) What is meant by the short-run, long-run, and very long-run, in for producers?