Discuss the following:
Case scenario:
From the data I gathered I developed histograms and calculated descriptive statistics.
Based on this data I then can make judgments on what I can expect to see when I buy packages of M&M's at the store.
To do this I calculate what is called confidence limits - these are based on the normal curve.
These confidence limits are what I expect to happen a certain percentage of the time based on the data I gathered unless something happens to change things.
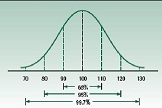
A 95% confidence limit is basically plus and minus two standard deviations from the mean in both directions
Illustration shows confidence limits of 68%, 95% and 99.7%.
For our M&M data - for the regular 1.69 size bags of M&M's, the historical average works out to be 56.5 M&M's per bag - with a standard deviation of 1.2 M&M's.
Response the following questions.
1. How can we use this information to determine what we should get in a bag of M&M's 95% of the time?
2. How do you think the M&M company uses this information in quality control?
Provide your own input not just a list of references.