Question 1. What are the investment proportions in the minimum-variance portfolio of the two risk funds, and what is the expected value and standard deviation of its rate of return?
Question 2. Suppose that you have $1 million and the following two opportunities from which to construct portfolio:
a. Risk-free asset earning 12% per year.
b. Risky asset with expected return of 30% per year and standard deviation of 40%.
If you construct a portfolio with a standard deviation of 30%, what is expected rate of return?
Question 3:
The following are estimates for two stocks.
Stock- Expected Return Beta Firm-Specific Standard Deviation
A 13% 0.8 30%
B 18 1.2 40
The market index has a standard deviation of 22% and the risk-free rate is 8%.
a. What are the standard deviations of stocks A and B?
b. Suppose that we were to construct a portfolio with proportions:
Stock A: .30
Stock B: .45
T-bills: .25
Compute the expected return, standard deviation, beta, and nonsystematic standard deviation of the portfolio.
Question 4:
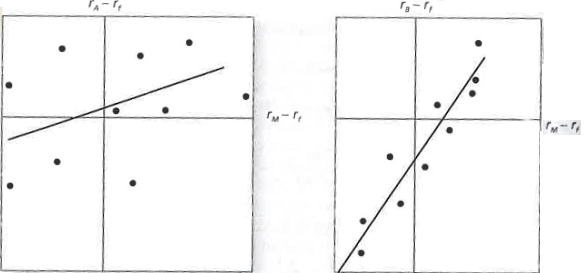
Consider the following two regression lines for stocks A and B in the following figure.

a. Which stock has higher firm-specific risk?
b. Which stock has greater systematic (market) risk?
c. Which stock has higher R2?
d. Which stock has higher alpha?
e. Which stock has higher correlation with the market?
Question 5:
Based on current divident yields and expected growth rates, the expected rate of return on stocks A and B are 11% and 14%, respectively. The beta of stock A is .8, while that of stock B is 1.5. The T-bill rate is currently 6%, while the expected rate of return on the S&P 500 index is 12%. The standard deviation of stock A is 10% annually, while that of stock B is 11%. If you currently hold a passive index portfolio, would you choose to add either of these stocks to your holdings?
Question 6:
I. When the annualized monthly percentage rates of return for a stock market index were regressed against the returns for ABC and XYZ stocks over a 5-year period ending in 2013, using an ordinary least squares regression, the following results were obtained:
Statistic ABC XYZ
Alpha -3.20% 7.3%
Beta 0.60 0.97
R2 0.35 0.17
Residual standard deviation 13.02% 21.45%
Explain what these regression results tell the analyst about risk-return relationships for each stock over the sample period. Comment on their implications for future risk-return relationships; assuming both stocks were included in a diversified common stock portfolio, especially in view, of the following additional data obtained from two brokerage houses, which are based on 2 year's of weekly data ending in December 2013.
Brokerage House Beta of ABC Beta of XYZ
A 62 1.45
B 71 1.25
Question 7: Here are data on two companies. The T-bill rate is 4% and the market risk premium is 6%.
|
Company
|
$1 Discount Store
|
Everything $5
|
|
Forecasted return
|
12%
|
11%
|
|
Standard deviation of returns
|
8%
|
10%
|
|
Beta
|
1.5
|
1.0
|
What would be the fair return for each company, according to the capital asset pricing model (CAPM)?
Characterize each company in the previous problem as underprised, overpriced, or properly priced.
Question 8:
When plotting portfolio R relative to the capital market line, portfolio R lies:
a. On the CML.
b. Below the CML.
c. Above the CML.
d. Insufficient data niven.