Assignment:
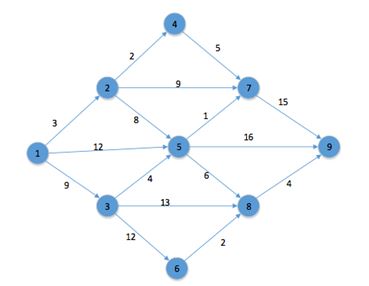
Q1. Suppose that you need to take a trip from city 1 to city 9 in below figure in the least amount of time. The figure shows the estimated times it will take you to go from one city to another. Follow the appropriate algorithm to find the optimal route.
a) Show manual work (by hand) step by step to reach the optimal answer (i.e., don’t just provide a final answer and don’t use a computer program to find a solution)
b) Provide a summary of the shortest times to go from city 1 to every city in the graph based on the solution in part (a)

Q2. Suppose that the above figure of Problem A represents distances among a set of 9 cities for which you are required to connect them with fiber optics cable to enable a faster internet service. Calculate the shortest amount of cable you need to connect all cities.
a) Show manual work (by hand) step by step to reach the optimal answer (i.e., don’t just provide a final answer and don’t use a computer program to find a solution). Provide also a summary of your solution.
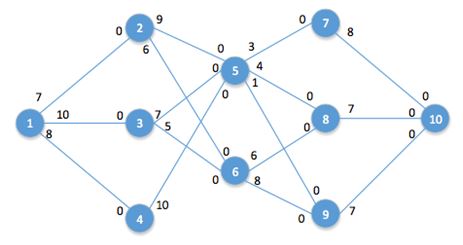
Q3. Figure below represents a water supply network that connects 10 cities. The amounts on the arcs represent the maximum daily amounts of water that can flow across the network in thousands of gallons. Determine the maximum amount of water that can flow through the system. Show your manual work (by hand) step by step to reach the optimal answer (i.e., don’t just provide a final answer and don’t use a computer program to find a solution). Provide also a summary of the solution.

Provide complete and step by step solution for the question and show calculations and use formulas.