Question 1
The Australian divorce rate has been steadily increasing over the years until late 1990s. However, data suggests that the rate has fallen in the most recent years. Age specific Australian divorce rates (in percentages) of male and female for few years between 1992 and 2012 are given in the attached Excel file (GB513Assignment-Q1.xls).
Using the information given in the data file, complete following tasks.
a. Use a graphical technique to compare the divorce rates in 1992, 2008 and 2012 broken down by age for Australian Male. Describe your graph.
b. Use a graphical technique to compare the divorce rates in 1992, 2008 and 2012 broken down by age for Australian Female. Describe your graph.
c. Compare your observations in parts (a) and (b) above to comment on the differences in divorce rate for male and female over the years.
Question 2
The Australian Bureau of Statistics recently released figures on petrol usage. Following are the 15 leading cities in 2012.

(a) Using the Data Analysis Tool in Excel, calculate the descriptive statistics.
(b) Briefly explain what each of the metrics in the summary statistics means.
(c) Comment on the figures in the report. What are they telling you about this data set? Is it symmetrical, flat, skewed, does it have outliers, and so on?
Question 3
A popular media poll revealed that 44% of Australian adults in the 18-34 years category think that ‘Made in Australia' ads boost sales. A different interactive poll showed that 78% of Australian adults in the 18-34 years category use social media. Suppose that 85% of Australian adults in the 18-34 years category think that ‘Made in Australia' ads boost sales or use social media. If an Australian adult in the 18-34 years category is randomly selected:
(a) What is the probability that the person thinks that ‘Made in Australia' ads boost sales and uses social media?
(b) What is the probability that the person thinks that ‘Made in Australia' ads boost sales given that the person does not use social media?
Please be sure to include all workings with your answers.
Question 4
The proportion of credit-card holders who pay their bill in full each month is 20%; the other 80% make only a partial or no payment.
(a) In a random sample of 17 customers, what is the probability that:
i. 4 customers pay their bill in full?
ii. More than 4 customers pay their bill in full?
(b) What is the expected number of customers who credit card bill in full?
(c) What is the standard deviation?
Question 5
The number of calls received by a phone operator at an emergency department between 10-11am has a Poisson distribution with a mean of 12.
(a) Find the probability that the operator received at least 5 calls during the following period.
I. 10-11am
II. 10-10.30am
III. 10-10.15am
(b) What is the probability that fever than 4 calls were received between 10 & 10.30am?
(c) What is the probability that 6 or more calls were received between 10 & 10.30am?
Question 6
According to a recent research report, the average monthly household mobile phone bill is $73. Suppose monthly household mobile phone bills are normally distributed with a standard deviation of $11.35.
(a) What is the probability that a randomly selected monthly mobile phone bill is no more than $55?
(b) What is the probability that a randomly selected monthly mobile phone bill is more than $100?
(c) What is the probability that a randomly selected monthly mobile phone bill is between $80 and $90?
(d) What is the probability that the average mobile phone bill of randomly selected sample of 25 bills is between $71 and $80?
Please be sure to include all workings with your answers.
Question 7
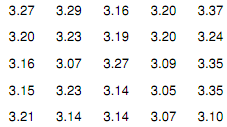
Suppose a study reports that the average price for a kilogram of grapes is $3.16. You believe that the price is higher in your area of the country. You decide to test this claim by randomly calling grocery stores. Your random survey of 25 stores produces the following prices (all in $). Assume grape prices for a region are normally distributed. Does the data you obtained provide enough evidence to support your belief?
Conduct a hypothesis test at 1% level of significance and clearly state your conclusion.
