Question 1. Measuring Output You are provided with the following information about an economy that produces three final goods: almonds, bicycles, and computers. The currency in use is the US Dollar ($US).
Table: Price and Quantity Data on Final Goods
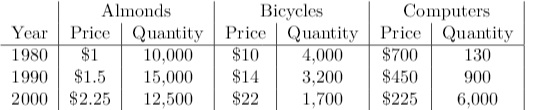
1.1 Compute nominal GDP in 1980, 1990, and 2000. Do you observe a trend in the data?
1.2 Compute the growth rate of nominal GDP from 1980-1990 and 1990-2000.
1.3 Using 1980 as the base year, compute real GDP in 1980, 1990, and 2000. Compute the growth rate of real GDP from 1980-1990 and 1990-2000. Do you observe a trend in the data?
1.4 Using 2000 as the base year, compute real GDP in 1980, 1990, and 2000. Compute the growth rate of real GDP from 1980-1990 and 1990-2000. Do your estimated growth rates agree with those from the previous part? Why or why not?
1.5 Using 1980 as the base year, compute the GDP deflator for 1980, 1990, and 2000. Compute the growth rate of GDP deflator from 1980-1990 and 1990-2000. Is this economy experiencing inflation or deflation? How do you interpret the growth rate of the GDP deflator?
1.6 Using 2000 as the base year, compute the GDP deflator for 1980, 1990, and 2000. Compute the growth rate of GDP deflator from 1980-1990 and 1990-2000. Do your estimates agree with those from the previous part? Why or why not?
1.7 Briefly discuss how real GDP (as a measure of output) depends on the base year. Does the base year matter?
Question 2. Building a Price Index:
Table: Price Data on Consumer Goods
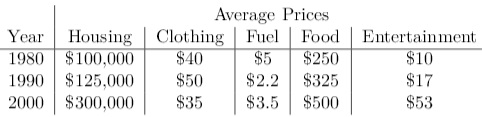
Table lists the average prices faced by consumers (from 1980-2000) across five categories of household expenditure: housing, clothing, fuel, food, and entertainment.
When calculating market basket expenditure, the Bureau of Labor Statistics wants you to use the following weights (fixed quantities) for each category of expenditure given in Table. The weights do not change over time. Given market basket expenditure in each year, you can compute the Consumer Price Index (CPI).
Table: CPI Weights
Category Weight
Housing 0.1
Clothing 0.1
Fuel 0.15
Food 0.55
Entertainment 0.1
2.1 Compute market basket expenditure in 1980, 1990, and 2000.
2.2 Using 1980 as the base year, compute the CPI for 1980, 1990 and 2000. Compute the growth rate of the CPI from 1980-1990 and 1990-2000. How do you interpret the growth rate of the Consumer Price Index?
2.3 Using 1990 as the base year, compute the CPI for 1980, 1990 and 2000. Compute the growth rate of the CPI from 1980-1990 and 1990-2000. Do your estimates agree with those from the previous part? Why or why not?
2.4 Using 2000 as the base year, compute the CPI for 1980, 1990 and 2000. Compute the growth rate of the CPI from 1980-1990 and 1990-2000. Do your estimates agree with those from the previous parts? Why or why not?
2.5 Briefly discuss how the growth rate of the CPI depends on the base year. Does the base year matter?
Question 3 Labor Market Outcomes
The following data on the labor market have been provided to you by the US Bureau of Labor Statistics. Due to an error in the transfer, the database has been corrupted and some entries are missing.
Table: US labor face
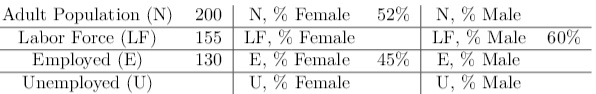
3.1 Complete Table above.
3.2 What is the US unemployment rate? What is the unemployment rate for females? What is the unemployment rate for males? 3.3 What is the US labor force participation rate? What is the labor force participation rate for females? What is the labor force participation rate for males?
Question 4 Historical US Unemployment The following table lists the US unemployment rate from 1933-1945
Table: US Unemployment Rate (% of LF)
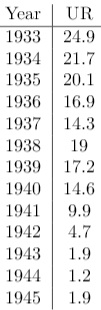
4.1 The unemployment rate before 1941 is much higher than the rate from 1941-1945. What do you think is the main component of unemployment from 1933 to 1940 (frictional, structural, cyclical, etc.)?
4.2 Is it possible to maintain a zero unemployment rate after 1945? Why or why not?
4.3 Assume that the US adult population over this period is constant at 100 million and the labor force participation rate is fixed at 80%. Calculate the number of unemployed persons in the US from 1933-1945
4.4 After 1945, suppose that the government implements a preferential tax scheme for women that encourages entry into the labor force. Briefly dis- cuss the possible effects on the unemployment rate and the labor force participation rate.