Total Quality Management-Tools Of Quality
Problem 1. Another issue ABC is facing is reliability of their products, in part because they are manufacturing increasingly complex products. One such product is designed and manufactured with five different subassemblies combined in series. It was determined through testing that those subassemblies have reliabilities, which are R1, R2, R3, R4, and R5; of .997, .998, .995, .999, and .990, respectively. ABC's president has asked you what the reliability of the overall product (RP) is, given those subassembly reliabilities utilized in series.

• Analyze this operations management issue.
• Provide the algebraic equation (using RP, R1, R2, R3, R4, and R5 as variables) for this analysis.
• Calculate and provide the overall product reliability, given those subassemblies utilized in series.
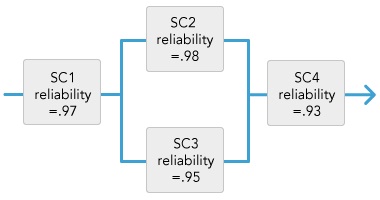
Problem 2. ABC's president has also asked you what the overall reliability of a different product (RP) is. That product has four subcomponents (SC1, SC2, SC3, and SC4). The components are organized as SC1, followed by SC2 in parallel with SC3, which are then both followed by SC4 (refer to the Question 4 Diagram). Their respective reliabilities are SC1R=.97, SC2R=.98, SC3R=.95, and SC4R=.93.

• Analyze this operations management issue.
• Provide the algebraic equation (using RP, SC1R, SC2R, SC3R, and SC4R as variables) for this analysis.
• Calculate and provide the overall product reliability given those subassemblies.
Problem 3. ABC Manufacturing is also concerned about the quality of its manufacturing processes. One of the products the company sells is a bottle of liquid lubricant associated with the pump product line. ABC's president is familiar with the operations management concept of control limits (determining an upper and lower numerical threshold such that a process is considered in control as long as it stays within those limits).
The president has asked you to take samples of the amount of liquid in those bottles and determine the upper control limit (UCL) and lower control limit (LCL) of three standard deviations. He told you that, based on previous testing, the standard deviation (SD) for this process is 0.035. You took sample measurements of the volume of liquid in the bottles, done at different times of the day (in case that somehow impacted the volume), and this produced the data in the Sample Measurements Table below:
Sample measurement table:
|
Time
|
Volume of Liquid in Bottles of Lubricant (in Ounces)
|
|
8:00am
|
30.03
|
|
9:00am
|
30.04
|
|
10:00am
|
29.98
|
|
11:00am
|
30.01
|
|
12:00pm
|
30.00
|
|
1:00pm
|
29.97
|
|
2:00pm
|
30.08
|
|
3:00pm
|
29.98
|
|
4:00pm
|
29.99
|
|
5:00pm
|
29.98
|
|
Mean (M)
|
30.006
|
• Analyze this operations management issue.
• Provide the algebraic equation for the UCL and for the LCL (using UCL, LCL, M, and SD as variables).
• Calculate and provide the numerical ULC and LCL values.