The Phase Line
Sketching the direction field of a differential equation dy/dt = f(t, y) is particularly easy when the equation is autonomous-that is, the independent variable t does not appear expelicitly
- dy/dt = f(y) .
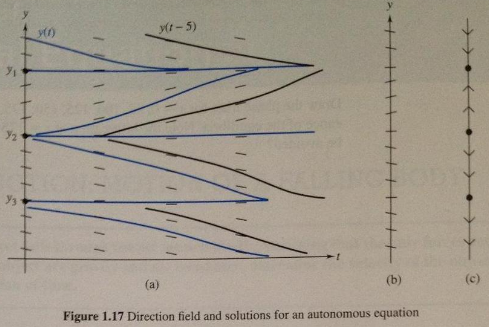
In Figure 1.17(a) the graph exhibits the direction field for -y' = -A(y- y1)(y-y1) (y - y2)2 and A > 0. and some solutions are sketched. Note the following properties of the graphs and explain how they follow from the fact that the equation is autonomous:
(a) The slopes in the direction field are all identical along horizontal lines.
(b) New solutions can be generated from old ones by time shifting (i.e., replacing y(t) with y(t - t0).
From observation (a) it follows that the entire direction field can be described by a single direction "line," as in Figure 1.17(b).

Figure 1.17 Direction field and solutions for an autonomous equation
Of particular interest for autonomous equations are the constant, or equilibrium, solutions y(t) = yi, i = 1, 2, 3. The equilibrium y = yi is called a stable equilibrium, or sink, because the neighboring solutions are attracted to it as I -->oo. Equilibria that repel neighboring solutions, like y = y2, are known as sources; all other equilibria are called nodes, illustrated by y = y3. Sources and nodes are unstable equilibria.
Attachment:- project.jpg