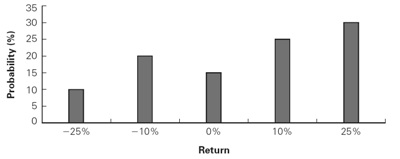
1.The figure below shows the one-year return distribution for RCS stock. Calculate
a. The expected return.
b. The standard deviation of the return.
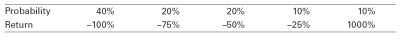
2.The following table shows the one-year return distribution of Startup, Inc. Calculate
a. The expected return.
b. The standard deviation of the return.
3.Characterize the difference between the two stocks in Problems 1 and 2. What trade-offs would you face in choosing one to hold?