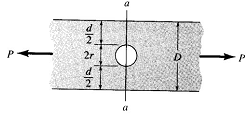
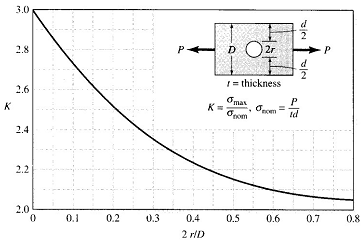
The figure below shows the geometrical stress concentration factor, K for a flat bar loaded in uniaxial tension. The bar has a uniform rectangular cross-section.
Working with values within the range 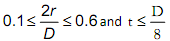 your task is to:
1. Construct a suitable finite element model and compare the FEA predictions with the theoretical data.
2. Produce a graph (within ANSYS) to show the stress distribution normal to the cross-section along line a-a shown here.