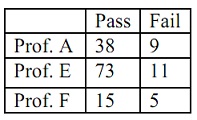
Question 1: A sample comprises of 151 students who took a history course at a college. The professor and the grade earned are recorded, and the results are summarized in the chart. Does the data meet up the needs for a test for independence? Describe.

Question 2: A sample of products produced on 3 assembly lines is summarized in the chart. With .05 significance, test the claim that being defective is independent of the line.

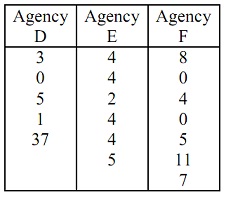
Question 3: The number of awards won by a sample of employees at three advertising agencies is given in the chart. With .10 significance, test the claim that the mean number of awards won by employees at the three agencies is similar.

Question 4: A sample of employees at a big company is asked if the company must change insurance carriers. The outcomes are listed in the table.

a) With .05 significance, test the claim that the proportions of yes, no and unsure votes in the company are .4, .4, .2, correspondingly. Use formulas.
b) If the claim was that each opinion takes place with similar frequency, compute the value of E.
Question 5: The weights of a sample of patients before and after taking an experimental drug are given in the table.

a) With .05 significance, use the Sign Test to test the claim which the median “before” weight is 200 lb.
b) With .05 significance, use the Sign Test to test the claim which the drug causes weight loss.
c) With .05 significance, use Wilcoxon Signed-Ranks Test to test the claim which the drug doesn’t impact weight.
Question 6: In a sample of 65 children in an elementary school, 19 have at least one unemployed parent.
a) With .05 significance, use the Sign Test to test the claim that less than half of the children at the school have at least one unemployed parent.
b) With .05 significance, use the Sign Test to test the claim that more than half of the children at the school have at least one unemployed parent.