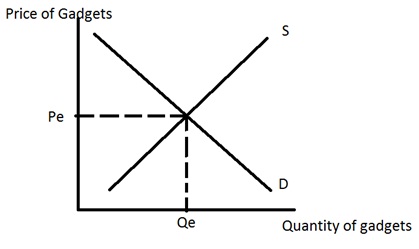
Question 1. Consider the following graph of the market for gadgets where Pe is the equilibrium price and Qe is the equilibrium quantity.

a. Redraw the graph illustrating an effective price ceiling, P1. Describe what must be true for this price ceiling to be effective. With an effective price ceiling, which side of the market is the short side? What is the effect of the price ceiling on the market and could this effect be a problem?
b. Redraw the graph illustrating an effective price floor, P2. Describe what must be true for this price floor to be effective. With an effective price floor, which side of the market is the short side? What is the effect of the price floor on the market and could this effect be a problem?
c. Suppose the government decides to limit the consumption of this good to Q1 units by imposing an excise tax. Assume that Q1 is a smaller amount of the good than Qe. Redraw the graph and label Q1. Then, on the graph indicate the price consumers will pay for the good once the tax is imposed, Pc; the price producers will receive after the tax is paid to the government, Ps; and the amount of the tax per unit.
d. Write an equation using the labels you used in (c) that describes the tax revenue the government receives when it imposes an excise tax on gadgets.
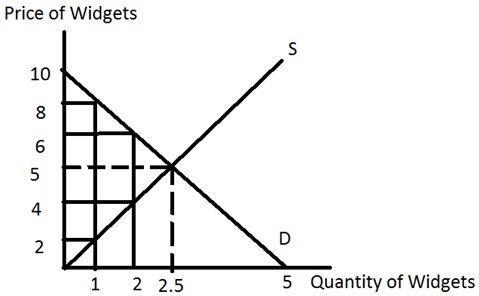
Question 2. Use the graph below of the market for widgets to answer this question. This market is initially in equilibrium at a quantity of 2.5 units and a price of $5 per widget. The demand and supply curves are both straight lines.

a. The government is considering imposing an excise tax in this market. It is trying to decide between an excise tax of $2 per unit, an excise tax of $6 per unit, or an excise tax of $10 per unit. Using the above graph fill in the table below.

b. Summarize from your table what happens to tax revenue in this market as the size of the excise tax increases. In your answer be sure to incorporate the concept of price elasticity of demand.
c. Summarize from your table what happens to deadweight loss in this market as the size of the excise tax increases.
Question 3: Question 2 provides an example of an excise tax that raises zero revenue for the government but where the deadweight loss from the excise tax is positive (if you did not get these results in #2, go back and rework the problem). Is it possible that an excise tax could have zero deadweight loss while raising positive tax revenue for the government? If you think it is impossible, please use one or two sentences to explain your answer. If you think it is possible, please provide an example.
Question 4. Suppose that a small, closed economy opens its market for bananas to free trade. If the world price of bananas is greater than the domestic price of bananas what do you predict will be the impact on this small economy of opening this market to trade?
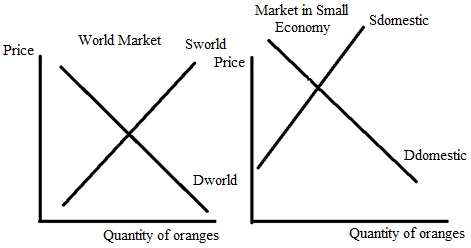
Question 5. In the space below are two graphs: the graph on the left represents the world market for oranges while the graph on the right represents a small, closed economy’s market for oranges. Note that although the horizontal axes in both graphs measure quantity, the quantity in the world market is in trillions of oranges while the quantity in the small economy is in oranges.

a. Given the above graphs, identify the world price of oranges (Pworld); the domestic price of oranges if the small economy is a closed economy (Pdomestic); and the level of imports or exports that will occur in this market if the small economy opens its orange market to trade. In the graph label the imports or exports clearly. In your own words, explain what determines whether this small country imports or exports the good when this market opens to trade.
b. In the space below draw two graphs based on the initial information you were given. In the first graph draw the small, closed economy and label the area of consumer surplus (CS closed) and producer surplus (PS closed) when the orange market is closed to trade. In the second graph draw the small economy after it opens the orange market to trade: label the areas of consumer surplus with trade (CS trade) and producer surplus with trade (PS trade). Provide an argument about whether trade is beneficial using these graphs as references. If this market opens to trade are there winners and losers in the small economy when this decision is made? Explain your answer using your graphs as reference points.
c. Suppose that the orange market in the small economy opens to trade, but that the domestic producers of oranges in this economy successfully lobby the government to impose an effective tariff on the market for oranges. Draw a graph of the small economy’s orange market and represent the world price (Pworld), the tariff price (Ptariff), the level of imports with the tariff, the area that represents tariff revenue that the government receives (tariff rev), the area(s) that represent the deadweight loss from the tariff (DWL), the area of consumer surplus with the tariff (CS tariff), and the area of producer surplus with the tariff (PS tariff). What happens to the level of imports when the tariff is imposed relative to the level of imports when this market opens to trade? When the government imposes a tariff and collects tariff revenue, who bears the economic incidence of this tariff? Explain your answer.
d. Suppose that the government decides it wants to achieve the same result as it got with the tariff in (c), but would prefer to use an import quota. What would the level of the import quota need to be in order for the two policies to be equivalent? How much per unit of import should the government charge the licensed importer in order to collect the same amount of revenue from this import quota as it did from the tariff described in (c)?
Question 6. Suppose that there is a manufacturer of Cool River Gingerale that produces a wonderful gingerale using the fresh, clean waters of Cool River. However, when this company produces the gingerale they also produce dirty, polluted water that they discharge back into the river. Since the river flows away from the company’s plant this polluted water does not affect the company’s ability to produce their amazing product, but it does make life less pleasant and healthy for everyone who lives and works below the plant. In a graph represent a diagram that illustrates this company’s view of the situation. Your graph should provide a demand curve for the product that follows the Law of Demand, a supply curve that represents Cool River Gingerale’s perception of the relationship between the price of the good and the quantity they will supply at each price, and a curve that represents the true cost of providing the good if we include the costs of pollution. Label your graph carefully and fully. In your graph indicate the quantity of gingerale that the company will produce as well as the optimal amount of gingerale from a social (societal) perspective. Given the above scenario and no intervention into this market, will the company produce too much or too little gingerale from a social perspective? Explain your answer. Is there a deadweight loss associated with the company’s choice of production level? Explain your answer.
Question 7. In class last week we discussed briefly the used car market, or the market for lemons. This idea was developed by George Akerlof who posited that if buyers and sellers had different information about the quality of the product (is the used car a “lemon” (a car that is of poor quality) or a “cherry” (a car that is of high quality)) that the market for this product would break down and not work well. This idea led me to think a bit about the dating market: it seems to me that the dating market is rife with information problems-how do you determine if the individual you think is attractive and interesting is a good choice or a bad choice (like the decision you would make in a used car market)? So, in the space below please spend a bit of time discussing (and let’s be thoughtful here):
i) In the dating market are there information problems? And, if so, describe or provide some examples of these information problems.
ii) How would you address these information problems if you were interacting in this market?
iii) It seems to me that this is a far more important decision than the selection of a used car, so my last question to you is this-does the “market for lemons” make you think a bit harder about the decisions one makes in the dating market?
Question 8. Wheelan discusses government regulation in his book. His analysis suggests that government regulation is a fairly complex topic with both arguments to support regulation as well as arguments against regulation. In the space below provide a recap of the arguments that would support some level of regulation as well as the arguments that would argue against regulation. How has the reading of the Wheelan text changed your perception of the issues of government regulation? Provide some examples that support your explanation/answer for this last question.
Question 9. Wheelan discusses the Hope Scholarship Program that was briefly supported during the Clinton Administration. In the space below describe how this program would work in your own words and then discuss the concept of adverse selection in the context of this program. Why did the Clinton Administration abandon this program?
Question 10. Suppose an economy has two groups of people, group A and group B. Group A-types have a perfectly elastic supply of labor at an equilibrium wage rate of $10 per hour. Group B-types have a perfectly inelastic supply of labor, and their equilibrium wage rate is $100 per hour. If an income tax is introduced into this economy, what will happen to the wage rates and employment levels of the two groups?