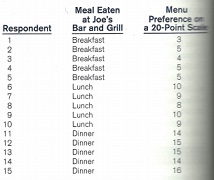
Solve the below:
The following table lists the results of one question taken from a survey conducted for Joe's Bar and Grill. The Grill has recently undergone renovations, and with the new look, management has decided to change the menu. They are interested in knowing how well customers like the new menus.
(a) Calculate the mean, standard deviation, and confidence interval for menu preference assuming simple random sampling was used.
(b) Calculate the mean, standard deviation, and confidence interval, for menu preference assuming stratified sampling based on the meal eaten and used (i.e. the strata being breakfast, lunch and dinner customers). Assume that N/N = 1/2 and each stratum. How do the results compare with those you obtained with the previous sampling plan? Why?
