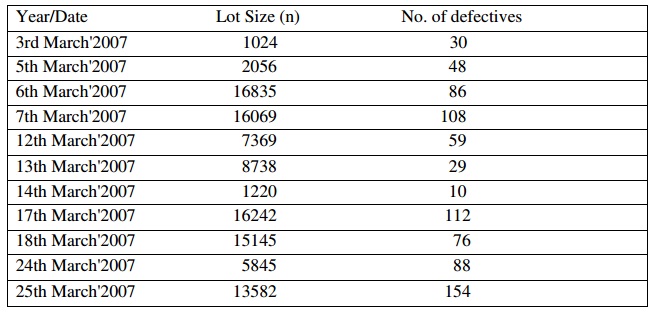
Question 1: From the given data you are required to plot a p-chart and draw the conclusions.
Question 2: Describe the various types of plant layout. What is meant by the statistical quality control?
Question 3: Compute the number of observations required for an accuracy of +/- 5 percent and confidence level of 95 percent, if the percentage occurrence of an activity is 0.8.
Question 4: Describe the factors finding out the location of industrial plant.
Question 5: What do you understand by work measurement? Explain how you find out standard time. Describe.
Question 6: Describe the concept of statistical quality control. Describe how you can construct control charts for the variables?
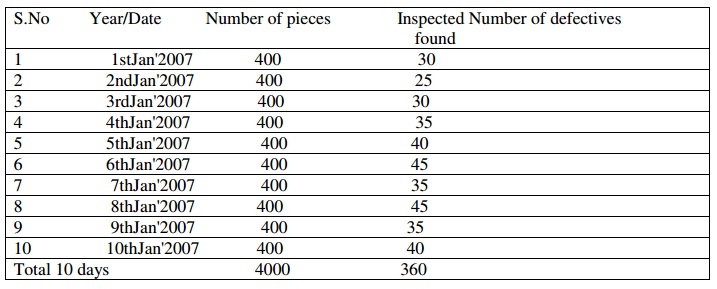
Question 7: The given are the results of daily inspection of a vacuum tube. Calculate the value of fraction defective for each day inspection and plot the P-chart.