Part 1 Management:'
For Part 1 of the Module Review activity, you will submit a Microsoft Excel® spreadsheet.
In Part 1 of this assignment, you will create a simple mockup of an executive dashboard by utilizing the Word application. Make Use of Microsoft Office 365®, access
Part 2 Module Review Practical:
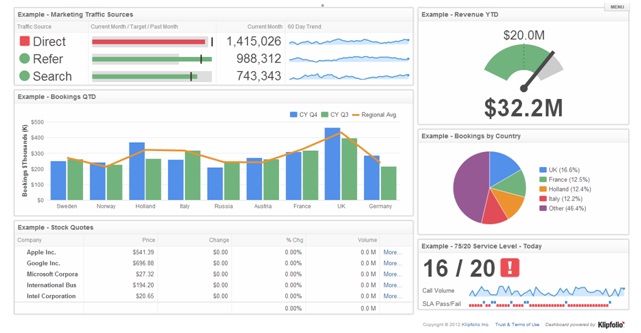
Microsoft® Dynamics CRM, Salesforce, and other cloud-based Customer Resource Management (CRM) solutions are utilized by companies to increase sales, improve customer service, and provide a host of other benefits. Dynamic digital dashboards are graphical user interface (GUI) tools that are present in CRM, Enterprise Resource Management (ERP), and other solutions that can depict a company's performance metrics in real-time. Executive dashboards enable managers to view disparate data without having to open up and view multiple applications in different windows or on different screens. Dashboards can be implemented out-of-the-box or customized to fit a management's purposes and desires.
For this practice assignment, you are a recent graduate and the newly-hired assistant to the VP of Sales of a large-scale wholesale aviation parts business. You have been tasked to create a document with a mockup of a proposed executive dashboard. This display will be utilized to provide data to an IT consulting firm that has been retained to implement a Microsoft® Dynamics CRM solution with customized executive dashboards.
The following is an example of an executive dashboard:

See page for author [GPL (https://www.gnu.org/licenses/gpl.html)], via Wikimedia Commons
Your mockup display of the proposed executive dashboard should contain six different types of charts. Some types of charts found in the MS Word application are as follows:
• Pie chart
• Line chart
• Column chart
• Bar chart
• Stock chart
• Histogram chart
• Combo chart
Steps:
Open a Word document and select "Landscape" in the "Orientation" selection of the "Layout" tab on the toolbar.
Select six different chart types chosen from the "Chart" selection data in the "Insert" tab on the MS Word toolbar. After you select a chart type from the list and select "OK," a Microsoft® Excel worksheet labeled "Chart in Microsoft Word" automatically opens with cells containing pre-set numerical data from the MS Word default chart example. You are required to modify the pre-set numerical data in each of the six worksheets. To replace the pre-set numerical data, use your Student ID number and insert from one to four digits using any combination. (Student ID number = 5406478).
Arrange the six charts in an orderly fashion, similar to the dashboard example shown above
Part 2 Macroeconomics (one page)
Discussion:
Work through the National Budget Simulation (Links to an external site.)https://www.econedlink.org/national-budget-simulator.php in an effort to achieve a budget deficit of $1100B dollars.
Scenario: The President of the United States has been elected on the promise of fiscal responsibility. By law he cannot reduce the net interest paid on the debt. The President's budget is projected to leave the country with a $1100B deficit.
The United States is subject to global security concerns. At the same time, a lingering recession and financial markets rescue package reduces the government's tax revenues and forces the government to increase its spending on unemployment benefits, welfare, housing assistance, food stamps, and other need-based programs. Because of the increased spending and reduced revenues, the nation falls into a projected deficit of nearly XXX in 2015 (This is the first piece of the information you need to find).
The President is committed to keeping his campaign promises in order to avoid future crisis over the US's financial standing. He must raise taxes, cut spending, or a combination of both to stay within his new guideline of a deficit below $1100B. The President turns to you, his trusted economic advisor, for help. (Note: While some events in this scenario reflect actual events, others are hypothetical for the purposes of this exercise. Budget figures in the simulation are actual White House figures of 2012, including spending and revenues of 2012.)
Given the information you watch and read in the preceding Module activities, use that background to answer the following questions for discussion. Since the simulation is using 2012 numbers, start off with actual numbers just to inject a sense of reality into this discussion. Research this information from a reliable source and begin your analysis with what you found. Detail your choices for cuts and spending, paying close attention to what you read in the Bowles and Montgomery articles. Finally, analyze the effect your choices will have on the economy.