Assignment:
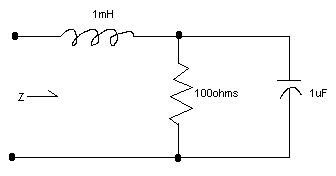
How to plot a graph for the following RLC circuit which shows the magnitude of Z (the input impedance) as a function of frequency from 10Hz to 10KHz?

Provide complete and step by step solution for the question and show calculations and use formulas.