Discuss the below:
All scientists, in any of the many disciplines, spend a great deal of their time collecting data and/or information. Usually this data will often be in mathematical form, i.e. it will consist of numbers.
The reason why scientists like to have data in numeric form is that it can then be analysed in detail. Scientists do this in order to make meaningful comments about the data they have collected. In scientific terminology we call this statistical analysis.
We will spend our time reviewing some of the simplest statistical terms that we are most likely to come across. These terms are as follows:
MEAN,
MEDIAN,
MODE,
RANGE,
MINIMUM,
MAXIMUM,
SUM,
COUNT.
Data Analysis Terminology
Do you know what all of these terms mean? On the pages that follow you will be asked to calculate theses terms for a set of data. To help you however we will first collect some data.
We will collect information on the height of everyone in the class.
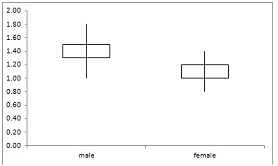
Q: Produce a single, labelled graph with 2 separate box and whisker plots of the height data for male and female students. Write a short paragraph that describes what the graph shows. An example is provided below.

| Hieght data (m) |
|
|
| male students |
female students |
| 1.7 |
1.6 |
| 1.7 |
1.6 |
| 1.7 |
1.6 |
| 1.8 |
1.6 |
| 1.8 |
1.6 |
| 1.8 |
1.6 |
| 1.8 |
1.6 |
| 1.8 |
1.6 |
| 1.8 |
1.6 |
| 1.8 |
1.6 |
| 1.8 |
1.6 |
| 1.8 |
1.6 |
| 1.8 |
1.7 |
| 1.8 |
1.7 |
| 1.8 |
1.7 |
| 1.8 |
1.7 |
| 1.9 |
1.7 |
| 1.9 |
1.7 |
| 1.9 |
1.7 |
| 1.9 |
1.7 |
| 1.9 |
1.7 |
| 1.9 |
1.7 |
| 1.9 |
1.7 |
| 1.9 |
1.7 |
| 1.9 |
1.8 |
| 1.9 |
1.8 |
|
1.8 |
|
1.8 |
|
1.8 |
|
1.8 |
|
1.8 |
|
1.8 |
|
1.8 |