Question 1:
a) The life time of electric bulbs for a random sample of 10 from a large consignment gave the given data:
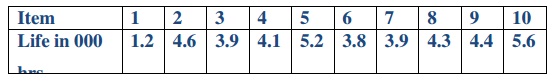
Can we accept the hypothesis that the average life time of bulbs is 4000 hrs.
b) 4 Coins were tossed 160 times and the given results were obtained.
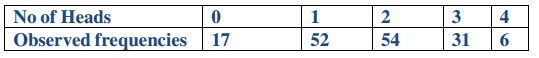
Under the assumptions that coins are balanced, find out the expected frequencies of 0, 1, 2, 3 or 4. Heads . Test the goodness of fit with α = 5%
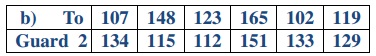
a) Compare the prices of a certain product in two cities ten shops were chosen at random in each town. The prices noted are given below.
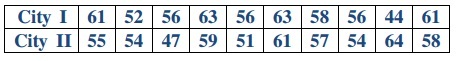
Test whether the average prices can be said to be same in the two cities.
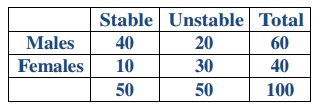
Question 2: The given table gives the classification of 100 work according to sex and nature of work. Test whether the nature of work is independent of the sex of the worker.
Question 3:
a) A random sample of 10 boys had the following I.Q’s 70, 120, 110, 101, 88, 83,95, 98, 107, 100. Do these data support the supposition of a population mean I.Q. of 100.
Use 0.01 level of significance to test whether the difference between two sample means is significant.