Question 1:
a) By using an illustration, in brief describe the circumstances under which the median would be a more appropriate measure of an average than the arithmetic mean.
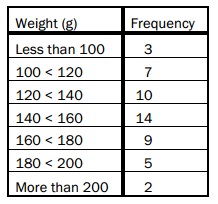
b) The given frequency table exhibits the weights, in grams, of a sample of 50 computer components produced in a factory on a specific day:

- Draw a histogram for this sample of component weights.
- Calculate the mean and standard deviation of the sample of weights.
Question 2: The quarterly sales figures for a specific model of smart TV over the period 2010 to 2012 are given in the table shown below:

a) Draw a graph of the time series and comment on any movements that might be present in the quarterly sales.
b) Compute the underlying sales trend by using the method of moving averages.
c) Supposing that a multiplicative model is most appropriate for this case, calculate the seasonal variations for each quarter’s sales.
Question 3: The personnel manager of a large company wishes to estimate the mean number of days lost via sickness per employee throughout the last year. To do this, she examined the records of a sample of 100 employees, and found that the mean of the sample turned out to be 15.3 days, with a standard deviation of 5.1 days. She as well discovered that 60 members of the sample indicated that ‘stress’ was one of the causes of their absence.
a) Find out a 95% confidence interval estimate for the overall mean number of days lost via sickness per company employee.
b) How large a sample would be needed for the personnel manager to be 95% confident that her sample mean differed from the true overall mean by at most 0.5 days?
c) Find out a 90% confidence interval estimate of the total proportion of employees who blamed stress for their sickness absence.
Question 4: A company has recorded the following data on production volume and total costs of production for one of its products over the last 8 months:
Production (000s units) 26 18 14 18 22 18 12 14
Total cost (£000s) 46 30 26 38 46 42 36 34
a) Draw a scatter diagram for the above data, and comment on its shape.
b) Compute the suitable least squares regression line so that total cost (Y) might be predicted from the level of production (X).
c) Predict the costs of production for next month when output is scheduled to be 30,000 units and in brief comment on the reliability of your prediction.
Question 5: A large builder’s merchant has analyzed the monthly amount spent by its trade customers, and it has found that it is normally distributed with a mean of £2,000 and a standard deviation of £500.
a) Estimate the percentage of customers that will have a monthly spend of:
- over £2,250
- less than £1,500
- between £1,250 and £1,750
b) The store wishes to reward the highest spending 5% of its customers with free gift vouchers. At what level of spend must the store offer this incentive?
Question 6: The sales department of a national automobile distributer wishes to analyze its weekly sales figures. The given table shows the total sales of a specific model of car over a period of 50 weeks:
57 53 56 75 46
47 43 54 43 51
62 41 73 65 45
72 50 59 68 56
71 52 58 79 60
77 38 54 59 65
38 54 80 54 56
57 55 67 67 82
70 61 83 56 42
49 56 53 68 52
a) By using the class intervals 30–40, 40–50, 50–60 and so on produce a cumulative frequency distribution of the weekly sales.
b) Draw a correctly labeled ogive.
c) From the ogive, estimate the median and quartile deviation of the weekly sales.
d) Estimate the proportion of time that the weekly sales fall between 65 and 80 cars.
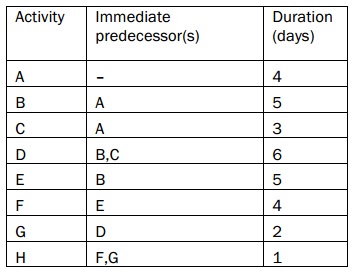
Question 7: The given information is extracted from a project to install a new office computer system:

a) Construct a network for the project.
b) Compute the scheduled completion time and recognize the critical path.
c) Compute the slack (float time) for ALL activities.
Question 8: A company manufactures two products, A and B. One unit of each product is made up of three raw materials, in the given quantities:

During a production run, supplies of material 1 and material 2 are limited to a maximum of 2,200 and 2,500 kg correspondingly. There is no limit to the availability of material 3.
Each unit of product A makes a contribution to profit of £5.50, while each unit of product B makes a contribution of £6.50, and the company wishes to maximize total profits.
a) Formulate this information as a Linear Programming model.
b) Use a graphical or mathematical method to find out the optimal production plan.