Topic for Assignment: Production Possibility frontier
Q1. Suppose that a country can manufacture just two things: goods and services. Suppose that over a given period it could produce any of the subsequent combinations:
Units of goods 0 10 20 30 40 50 60 70 80 90 100
Units of service 80 79 77 74 70 65 58 48 35 19 0
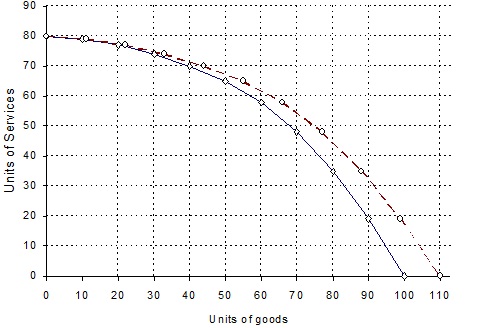
(a) Draw country’s production possibility curve.
(b) Supposing that the country is currently manufacturing 40 units of goods and 70 units of services, what is the opportunity cost of manufacturing another 10 units of goods?
(c) Elucidate how the figures exemplify the principle of increasing opportunity cost.
(d) Now suppose that technical progress leads to a 10 per cent raise in the output of goods for any given amount of resources. Draw new production possibility curve.
How has the opportunity cost of producing extra units of services altered?
(a) See the continuous line in Diagram below.
(b) 5 units of services producing another 10 units of goods mean producing a total of 50 units of goods. Therefore, referring to the table,production of services has to be declined from 70 units to 65 units: a sacrifice of 5 units of services.
(c) Each additional 10 units of goods produced involves a raising sacrifice of services. Thus increasing production of goods from 0 to 10, to 20, to 30, to 40, etc. involves a sacrifice of 1 (80–79), then 2 (70–77), then 3 (77–74), then 4 (74–70), etc. units of services.
Likewise, raising the production of services involves an increasing sacrifice of goods. This can be seen by starting at the right-hand end of the table and moving to the left. Smaller and smaller raises in services are obtained for each extra 10 units of goods sacrifice: in other words, for each extra unit of services obtained, more and more goods must be sacrificed.
(d) See the dashed line in Diagram below. The opportunity cost of producing extra services has risen (by 10 per cent): in other words, each extra unit of services produced involves a sacrifice of 10 per cent more goods than previously.
