I. Binary choice
Problem 1. Suppose the average dollar cost per year of attending college at a four-year public university in 2011-2012 was 5.6 times as high as it was in 1981-1982. You are also told that the CPI was 2.6 times as high in 2011-2012 as it was in 1981-1982. Based on this information, the real price of college from 1981-1982 to 2011-2012
a) Rose.
b) Fell.
Problem 2. Consider a movie theater. Suppose that the price elasticity of demand for a typical movie that the theatre shows is 1.2. If the movie theater then shows a movie that is notably more popular than the typical movie shown, then this popular movie will most likely have a price elasticity of demand
a) Less than 1.2.
b) Greater than 1.2.
Problem 3. Suppose you have a linear demand curve and you are considering a price that is greater than the price at which the price elasticity of demand is 1.0. At such a price you would conclude that demand is
a) Elastic.
b) Inelastic.
Problem 4. In a perfectly competitive industry, new firms will enter the industry in the long run if
a) Economic profits are greater than zero in the short run.
b) Accounting profits are greater than zero in the short run.
Problem 5. Which of the following two statements best describes the CPI?
a) It is the dollar price of a market basket of goods that represents the consumption pattern of a typical consumer.
b) It is an index based on a ratio of the dollar price of a market basket of goods relative to what the cost of the market basket of goods was in a base year.
II. Multiple choice
Problem 6. Suppose the average nominal cost per year for attending a 4-year public university in 2011-2012 was $17,000 when the CPI was 230, and the average nominal cost was $2,700 in 1981-1982 when the CPI was 90. What was the real dollar cost of attending college in 1981-1982 that would be directly comparable to the current dollar cost in 2011-2012?
a) $2,700
b) $17,000 X (90/230)
c) $17,000 X (230/90)
d) $2700 X (90/230)
e) $2,700 X (230/90)
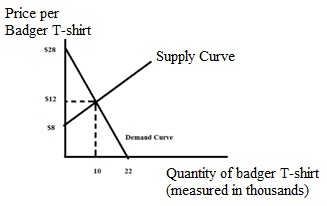
Use the figure below to answer the next question. The figure depicts the market demand and supply curves for Badger T-shirts.

Problem 7. The market for Badger T-shirts is in equilibrium at 10,000 per year, at a price of $12 per T-shirt. Given this information, the value of consumer surplus is ______ and the value of producer surplus is _______.
a) $160,000; $40,000
b) $80,000; $20,000
c) $50,000; $50,000
d) $140,000; $120,000
e) $280,000; $12,000
Problem 8. Consider Wanda’s consumption pattern this summer in Madison. She tries to avoid eating too much ice cream and French fries but she loves them too much to give them up entirely. She buys ice cream cones for $3 each and for the last ice cream cone she purchased she got 150 utils of satisfaction; she buys French fries for $2 an order, and she got 50 utils from the last order of fries she bought. (Note: MU = marginal utility, P = price, C = cones of ice cream and F = French fries.) This means that:
Wanda should buy _______ ice cream cones since MUC/$1 is ________ than her marginal utility from the last dollar spent on fries. As she gets ________ cones, the MUC will _________ . She should stop buying cones when the MUC/PC ______ .
a) more; higher; more; decrease; = MUF/PF
b) less; higher; less; decrease; > MUF/PF
c)more; higher; more; increase; = MUF/PF
d) less; higher; less; increase; = MUF/PF
Problem 9. Wilbur spends $100 a week on food and $30 a week on entertainment. Then food prices drop so much that he can eat the same way for only $80. Once the price of food drops, Wilbur changes his spending habits so that he spends $80 a week on his usual foodselection plus another $5 a week for ice cream for his meals, he spends an additional $10 a week to add fresh fruit to his diet. Finally he spends an additional $5 more a week on entertainment than he did initially. From this information we can see that
a) Only the substitution effect clearly caused him to consume more entertainment.
b) Only the income effect clearly caused him to consume more entertainment.
c) Both the income and substitution effect clearly caused him to consume more entertainment.
d) Only the substitution effect caused him to consume more food.
Problem 10. Consider an individual consumer with an income of $40, who consumes only two goods-- pizza at a price of $12 and hamburgers at a price of $4. Let QP and QH be the quantity of pizza and the quantity of hamburgers, respectively. The slope-intercept form of the equation for his budget line with QH on the vertical axis is
a) 10QP + 4QH= 120
b) QP = 10 – 3QH
c) QP = 10 + 3QH
d) QH = 10 – 3QP
e) QH = 10 + 3QP
Problem 11. When an intervention in a market causes deadweight loss, we can measure the size of this deadweight loss by
a) The value of the decrease in output due to the intervention.
b) The decrease in consumer surplus due to the intervention.
c) The value of the increase in output if the intervention causes a misallocation of resources that results in an inefficient increase in the production of a good due to the intervention.
d) The average of the decrease in producer surplus and consumer surplus due to the intervention.
e) The decrease in total surplus due to the intervention.
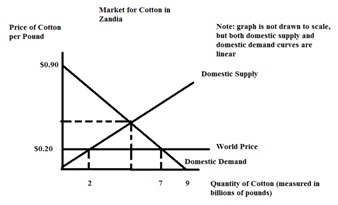
Use the following figure to answer the next two questions. The figure depicts the cotton market for Zandia which is a small, open economy.

Problem 12. In the above figure, domestic consumer surplus is ______ billion, and domestic producer surplus is _____ billion dollars.
a) $24.5; $2.00
b) $4.9; $0.40
c) $2.45; $2.00
d) $4.9; $4.00
e) $2.45; $0.20
Problem 13. In the above figure, when this market is open to trade and the world price is $0.20/pound then domestic production is _____ billion pounds and imports are _____ billion pounds.
a) 2; 5
b) 2; 7
c) 7; 2
d) 2; 2.5
e) 5; 2.5
Problem 14. Consider the market for pens in a small, open economy. You know that the domestic demand and domestic supply curves for pens are given by the following equations where P is the price per pen and Q is the quantity of pens given in billions:
Domestic Demand: Q = 9 – 10P
Domestic Supply: Q = 10P
Furthermore, you know that the world price of pens is $0.20 per pen. Suppose this small economy imposes an import tariff on pens of $0.10 per pen. Given this information and holding everything else constant, then the quantity of imports into this economy with the tariff would be _______ billion pens.
a) 1.5
b) 6.0
c) 3.0
d) 9.0
e) 5.0
15. Consider a small, closed economy that produces baskets. This country knows that its domestic demand and domestic supply curves are given by the following equations where P is the price per basket and Q is the number of baskets:
Domestic Demand: P = 0.8 – 0.1Q
Domestic Supply: P = 0.1Q
Furthermore, the country knows that the world price of baskets is $0.10 per basket. This country has decided to open its basket market to trade while simultaneously imposing an import quota of 2 baskets. Given this information and holding everything else constant, the imposition of this import quota will result in a domestic price of baskets equal to ______ and domestic production of baskets equal to ______.
a) $0.20; 2 baskets
b) $0.40; 4 baskets
c) $0.30; 2 baskets
d) $0.30; 3 baskets
e) $0.10; 1 basket
Problem 16. Consider the market for the NCAA Final Four Men’s Basketball games. If the Badgers make it to the final four, the price elasticity of demand for tickets to the game from those wildly excited Badger fans is most likely to be close to which of the following values?
a) 2.5
b) 2.0
c) 1.5
d) 1.0
e) 0.5
Problem 17. Suppose the cross price elasticity of demand for gas with respect to the price of cars is-0.5. Then if the price of cars rises 10%, the quantity of gasoline purchased would _____ by ____.
a) Increase; 5%
b) Increase; 20%
c) Decrease; 5%
d) Decrease; 20%
Problem 18. Because of the very slow recovery in the economy from the financial crisis, total income of households is about 6% lower than it otherwise would be. If the income elasticity of demand for college education is 0.8, then other things equal,we would expect that the lower income would cause the number of full-time equivalent students to ____ by _____ percent.
a) Increase; 4.8
b) Increase; 7.5
c) Decrease; 4.8
d) Decrease; 7.5
Problem 19. The demand curve given for a good is: P = 12 – Q. On this demand curve, the elasticity of demand will be 1.0 at a price of____; therefore, raising the price above this will________ revenue.
a) $10;decrease
b) $8;increase
c) $6;decrease
d) $4;decrease
e) $2;decrease
Problem 20. Marginal cost represents how much:
a) Total cost increases when the quantity of output increases by one unit.
b) Fixed cost increases when the quantity of output increases by one unit.
c) Average total cost increases when the quantity of output increases by one unit.
d) Average fixed cost increases when the quantity of output increases by one unit.
Problem 21. The marginal cost curve:
a) Intersects the average total cost curve at the minimum point of the average total cost curve.
b) Intersects the average variable cost curve at the minimum point of the average variable cost curve.
c) Intersects the average total cost curve above the minimum point of the average total cost curve.
d) Intersects the average total cost curve below the minimum point of the average total cost curve.
e) Both answers (a) and (b) are correct.
Problem 22. Assume a perfectly competitive industry, with constant returns to scale, that is initially in long run equilibrium. Now suppose the market demand curve in this industry shifts to the right.
This indicates _____ demand for the good. In the short run, the market price will _____ and the market output will _____. In the long run, the market price will __________ and the market output will ______.
a) More; increase relative to its initial level; increase relative to its initial level; increase relative to its initial level; return to its original level
b) More; increase relative to its initial level; increase relative to its initial level; return to its original level; increase relative to its initial level
c) Less; decrease relative to its initial level; decrease relative to its initial level; return to its original level; decrease relative to its initial level
d) More; increase relative to its initial level; decrease relative to its initial level; increase relative to its initial level; decrease relative to its initial level
e) Less; decrease relative to its initial level; increase relative to its initial level; decrease relative to its initial level; increase relative to its initial level
Problem 23. Assume a perfectly competitive industry. In the short run the supply curve of a firm will be its ______ cost curve at or _____ its ______ cost curve, and the market supply curve will be the ________ summation of the firms’ individual supply curves.
a) Marginal; above; average total; horizontal
b) Marginal; below; average total; vertical
c) Average total; above; average variable; horizontal
d) Marginal; above; average variable; horizontal
e) Average total; above; marginal; vertical
24. The marginal revenue curve for a monopolist
a) Is identical to the market demand curve.
b) Lies below the market demand curve.
c) Lies above the market demand curve.
d) Is identical to the monopolist’s marginal cost curve.
25. Anunregulated monopolist will
a) Produce that level of output where its marginal revenue equals its marginal cost.
b) Determine the price it will charge by selecting that price from its demand curve that is associated with its profit maximizing quantity.
c) Maximize profit, which is total revenue minus total cost.
d) Answers (a), (b) and (c) are all correct answers.
Section III: 2 Problems
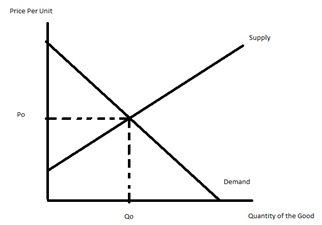
Problem 1: The figure below represents the market for a good that initially is in equilibrium at PO and QO.

Then the government levies an excise tax of $5 on the sale of each item, and the seller pays the tax to the government. After the tax has been imposed:
a) Draw in a new supply curve on the above graph, and label it ST.
b) Indicate a distance between S and STin the above figure that represents $5 and label this distance $5.
c) Indicate the new equilibrium quantity in the above figure and label it QT.
d) Show the new equilibrium price in the above figure and label it PT.
e) Sketch in the rectangle in the above graph that represents the dollar value of the taxes the government would collect, and fill in the rectangle as follows:
f) Indicate a segment on the vertical axis which shows how much more buyers pay per unit after the excise tax, and label this segment, ΔPB.
g) Indicate a segment on the vertical axis which shows how much less the seller receives per unit, after paying the excise tax, and label this segment, ΔPS.
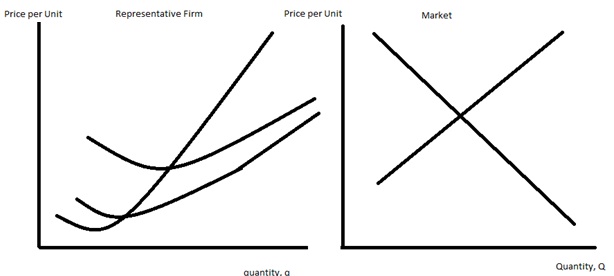
Problem 2: The diagrams below are for a representative firm and for the market in a perfectly competitive industry in the short run.

For the market:
a) Show the short run equilibrium price and quantity in the market and label them in the above graph, Pe and Qe.
For the representative firm:
b) Label the average variable cost curve, AVC, the average total cost curve, ATC, and the marginal cost curve, MC in the above graph.
c) Draw in and label the firm’s marginal revenue curve, MR, in the above graph.
d) In the space below, write an equation that determines the profit maximizing quantity of output for the representative firm.
e) Show the profit maximizing quantity for the representative firm in the above graph, and label this quantity,qe.
f) In the above graph draw a rectangle that represents the representative firm’s short run economic profit, and shade this rectangle as follows:
g) Determine the price at which the representative firm would shut down in the short run, and label this price Psd.