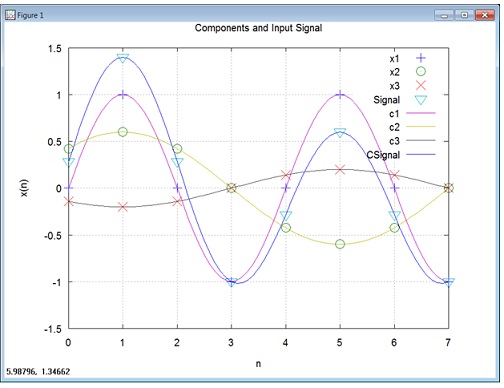
Question 1)a) Using Octave, generate a signal, x(t), as shown below along with its components. Assume a sampling frequency (fs) of 8000 second. You must plot the individual components (e.g. component 1 = sin(2π2000t), component 2 = 0.6 sin(2π1000t + π/4 and component 3 = + 0.2 sin(2π1000t -3π/4) along with the composite signal. You must also descriptive each component as “continuous” signal to provide better view of the forms of resultant waves.
x(t) = sin(2π2000t) + 0.6 sin(2π1000t + π/4) + 0.2 sin(2π1000t -3π/4)
Make sure to include, axis labels, legends, and a title on your plot.
Below is one possible outcome that would satisfy plotting requirements. Notice, the discrete data points for each of components and composite signal are shown along with a higher resolution more continuous waveform. (Hint: To make the continuous looking waves just show more data points, in Octave this could be: n=0:0.1:7 as opposed to n=0:7).
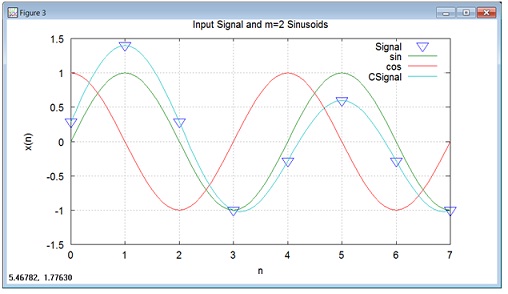
b) Use Octave to generate and plot composite signal, along with the 1KHz sinusoids for m=1, m=2 and m=3. Make sure to include, axis labels, legends, and a title on your plot. Below is one possible outcome that would satisfy the plotting requirements for m=2. Notice the Signal would be the same on all plots. You would be including the Octave code to generate the plots for m=1, m=2 and m=3 sinusoids
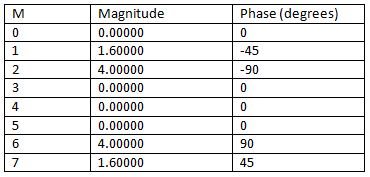
c) Using Octave, to generate an 8-point DFT on x(t). You must provide the output table showing the magnitude and phase (in degrees) for each of the 8 points. The table below shows a possible result.
d) Shift the x(t) signal by 5 positions forward and rerun the Octave routine to generate an 8-point DFT. Demonstrate your original and shifted signal along with an output table showing the magnitude and phase (in degrees) for each of the 8 shifted points. The table below shows a possible result.
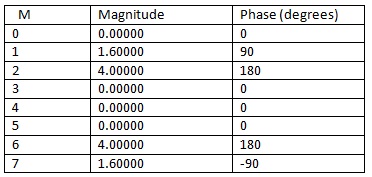
Compare the results of the original 8-point DFT with the elements shifted by 5. Comment on the results of the shift and its impact on the DFT. Make sure to discuss any changes in magnitude and phase.
e) Using the output from the original DFT in part c, use Octave to run an Inverse DFT. Demonstrate that the results from the inverse DFT and original x(t) values are the same. You can demonstrate they are the same by side by side comparisons in a table or a plot.