Assignment:
1 Which of the ordered pairs (3, 1), (0, -4), (-4, 0), (-3, -7) are solutions for the equation x - y = 4?
A) (0, -4), (-4, 0), and (-3, -7)
B) (-4, 0) and (-3, -7)
C) (0, -4) and (-3, -7)
D) (3, 1) and (-4, 0)
2 Which of the ordered pairs is a solution for the equation 4x - 2y = 8?
A) (0, 4) B) (-2, 0)
C) (-2, -4) D) (0, -4)
3 Complete the ordered pairs for the equation y = 6x + 6.
4 An employee who produces x units per hour earns an hourly wage of y = 0.55x + 12 (in dollars). Find the hourly wage for an employee who produces 20 units per hour.
A) $23.00 B) $23.50 C) $22.70 D) $23.40
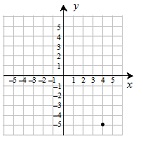
5 Give the coordinates of the point graphed below.
A) (5, -4) B) (-4, 5) C) (4, -5) D) (-5, 4)
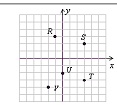
6 Give the coordinates of the points graphed below.
7 Graph x + y = -2.
8 Graph y = 3x.
9 Graph 3x + 2y = 6.
10 Graph y = -x/2
11 Graph using the intercept method: 5x - y = 5.
12 Graph by first solving for y.
x - 3y = 9
13 Find the slope of the line passing through the points (1, 2) and (3, 6).
A) 0 B) 1 C) 2 D) Undefined
14 Find the slope of the line passing through the points (-4, 0) and (-4, -2).
A) 0 B) 1 C) -2 D) Undefined
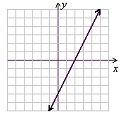
15 Find the slope of the graphed line.
A) 2 B) -2 C)1/2 D) - 1/2
16 If y varies directly with x, and y = 30 when x = 6, find the constant of variation k.
17 Let y vary directly with x, with a constant of variation k = 3. Graph the equation of variation.
18 Use the following table to answer the question.
Population of Europe by Age Groups
Population (in thousands)
1950 1970 1995
Age 0-14 143,175 166,367 139,464
Age 15-64 359,162 421,432 487,110
Age 65+ 44,981 68,642 101,338
Age 75+ 14,553 22,762 38,139
Total 547,318 656,441 727,912
Source: European Rural Development (ERD) Project.
What was the age 65+ population of Europe in 1970?
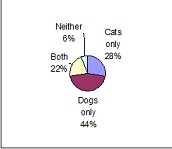
19 The following pie chart represents the results of a survey about whether people in a certain town have cats or dogs as pets.
If there are 500 people in the town, how many people have both cats and dogs?
20 These data represent the population of a certain city.
Year Population (in thousands)
1950 18
1960 23
1970 29
1980 32
1990 38
2000 42
(a) Draw a line graph for the data.
(b) Use the line graph to predict the population in the year 2010.