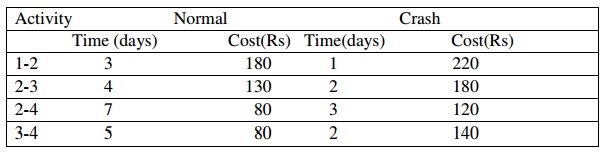
Question 1: Given the cost and time data for a specific project. Find out the optimal cost Schedule for the project by drawing project schedule versus total cost. Overhead cost is Rs. 50 per day.
Question 2: Describe the uses of variance and expected time in relation to critical paths in a PERT network.
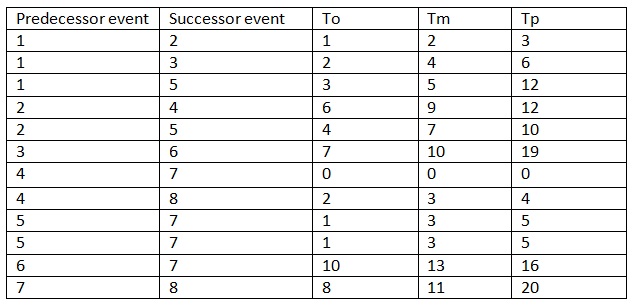
Question 3: The relationship between the activities of a project is given below. Draw the network. Compute slack at each event. Show the critical path and normal project duration.
Question 4: What is PERT and what are the applications of PERT?
Question 5: Describe the methodology for applications of network analysis to resolve engineering problems.
Question 6: Describe various rules for drawing network by using an example.
Question 7: Distinguish between a P.E.R.T network and CPM network.
Question 8: A project comprises of seven activities. Activities P, Q, R run simultaneously. The relationship among the different activities is as follows:
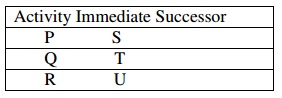
Activity V is the last operation of the project and it is as well immediate successor to S, T and U. Draw the network of the project and number the events according the Fulkerson's rule.