1. Describe open and closed loop control systems. Explain differentiation between time varying and time invariant control system with appropriate example
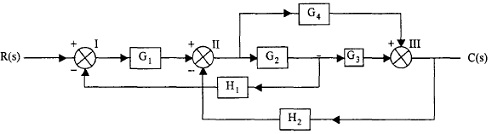
2. Derive Transfer Function of the subsequent diagram using signal flow graph.
3. Consider characteristic equation; find out stability of the system with Routh Hurwitz criterion
S6 + S5 + 6s4 + 5s3 + 10s2 + 5s + 5
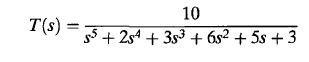
4. Find out the stability of the closed-loop transfer function
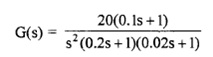
5. The frequency response of the plant transfer function H(s) may be found by evaluating the following:
M = |H(s)|s = jw and Φ = arg|H(s)|s = jw
Where M is the magnitude and is the phase shift. Find out the frequency response assuming the following transfer function.
a) Draw magnitude response in the space provided. Mention the frequency and magnitude on graph
b) Exemplify the effects of individual pole and zeroes response in the semi log graph
c) Elucidate magnitude response of zero

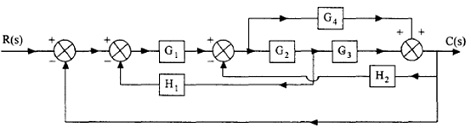
6. Find out the transfer function using block diagram reduction technique