One of the points is suspected of being a bivariate outlier. When this point is removed, the new correlation is r = -.833. Is this point likely to be a bivariate outlier? Explain your answer.
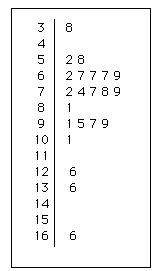
The following stem plot represents the yearly percentage increases in Dickinson's comprehensive fees over the past 22 years. (3 | 8 means that one year had a percentage increase of 3.8%.)