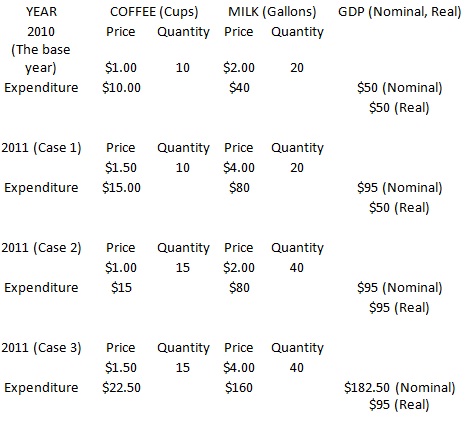
Suppose an economy produces only two goods, cups of coffee and gallons of milk, as shown in Table: Illustrated below:
Table: Nominal Versus Real GDP

Q1. Calculate the expenditure on each good and the nominal and real GDP for 2010, the base year.
Q2. Repeat this exercise for each of the three alter-native cases (1, 2, and 3).
Q3. Explain the differences between nominal GDP and real GDP in each of these cases.
The following table shows the labor force data: The percent of the population in the labor force has increased from 60 percent in 1969 to more than 66 percent in 1992 and later years. The unemployment rate was very low during the booming periods of the late 1960s and the late 1990s. It increased substantially during the recessions of 1982 and 1991. The "jobless recovery" from the 2001 recession is evidenced by the relatively high unemployment rate in 2003. Although the 2007 figures had not yet shown the impact of the slowing economic activity in 2007 and 2008, the impact of the recession from 2007 to 2009 is shown in the 8.9 percent unemployment rate in 2011.