Question 1: Consider the following frequency counts of some item sets in a transaction database r:
freq({A}, r) = 0.405
freq({B}, r) = 0.510
freq({C}, r) = 0.303
freq({A,B}, r) = 0.380
freq({A,C}, r) = 0.256
freq({B,C}, r) = 0.197
freq({A,B,C}, r) = 0.095
Based on this information, you can use them to compute the following probabilities. (example: P(X) = freq(X, r)).
a) What is the joint probability P(A and B)? What is P(A) ? P(B)?
b) What are the confidence and lift ratio of the association rules generated from the following itemsets: {A, B, C} and {A‾, B}?
c) Compare the results of a) and b) with the frequencies freq({A}, r) and freq({B}, r). What observations can you made about the relationship of A and B in terms of independence and possible causal relationship? Please describe your answer.
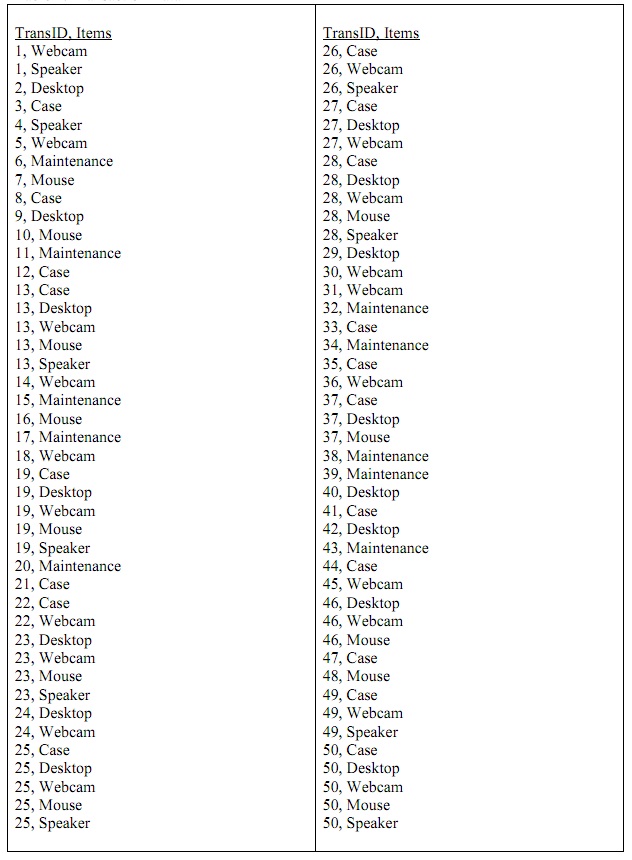
Question 2: Your friend owns a computer store in Yuen Long, selling Desktop and Notebook PCs and other computer peripherals. Having been instead successful with his business there, he decided to venture to the infamous Mongkok Computer Center and has already been there for three months. As expected, compared to his Yuen Long store, his new store has been recording much larger revenue however when it comes to profit, he is not so sure. He requires to pay some times more in rent! In order to stimulate sales, your friend feels that he requires to understand his customers in Mongkok more. To help him do so, you have asked for a sample of the transactional data he collected and they are shown in table below.

a) Set the Minimum Support to 18% and Minimum Confidence to 80%, find all frequent large itemsets (for product items) and all interesting rules using the Apriori algorithm.
b) By setting the Lift Ratio to 2, which rules you discovered in Part (a) are still interesting?
c) How many possible association rules (even though both the support and confidence are 0) would be generated from the following itemsets: {Case, Desktop, Maintenance, Mouse, Speaker, Webcam} and {Computer, Printer, Peripherals, Notebook_PC}. Compare the results, what you can conclude?
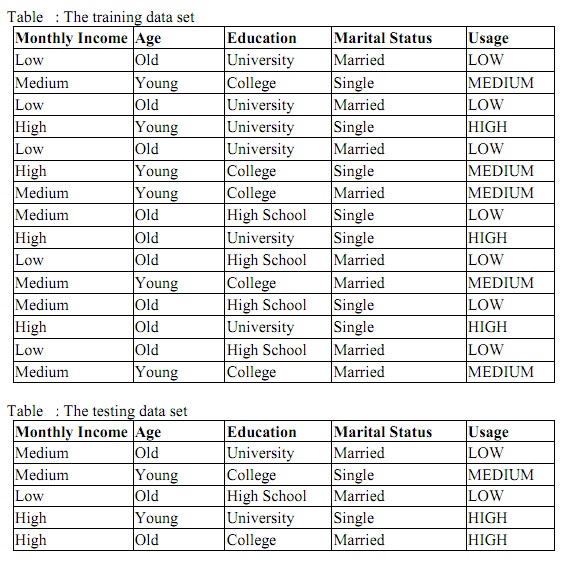
Question 3: You are working for the ABC Telecom and are given some customer records for data mining. You are asked to discover, from the data, patterns that characterize low-, medium- and high-usage customers. He would like to make sure that newly recruited salespersons be able to recommend the right service plans (500-free-mins (low-usage), 2500-free-mins (medium-usage), and 5000-free-mins (high-usage)) to the right customers.
a) Show how you can make use of the ID3 algorithm to discover in a sample of customer records (shown in Table below) what best plan to make to which kind of customers.

b) You are given a testing data set (shown in Table above) as follows, how much should you trust the recommendations made according to the rules discovered by ID3 algorithm?
c) Use the Naïve Bayesian Approach to check the recommendations against the testing data set. How many recommendation(s) is/are trustful?
d) Given a choice between the Naïve Bayesian Approach and the ID3 algorithm for this task, which one would you choose? Why?