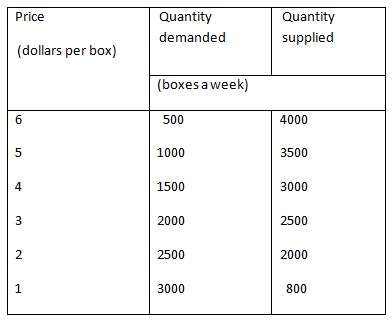
The table sets out the demand-supply schedules for banana.

Q1. Draw a proper graph of the market for banana. Illustrate the equilibrium price and quantity? Explain why.
Q2. If the price of banana was $1.50 a box. What would be the condition in the banana market (shortage or excess)? Describe why and how the price and quantity would adjust.
Q3. Assume that a cyclone destroyed some banana farms in QLD and the quantity of banana supplied reduced by 500 boxes a week at each price. Describe what would happen to the market supply-demand and how would the equilibrium price and quantity adjust? Describe the changes on your graph.
Q4. Assume that a cyclone reduced banana supply by 500 boxes a week at each price. However, at the same time the demand for banana raised by 500 boxes a week at each price. Describe what would happen to the market equilibrium price and quantity? Describe the changes on your graph.