Problem 1. Consider the loanable funds market depicted below. In this graph assume that the demand for loanable funds curve depicts the private demand for loanable funds and that the supply of loanable funds curve represents the saving of households. Assume that initially the government is running a balanced budget and that there is balanced trade (neither a trade surplus or a trade deficit
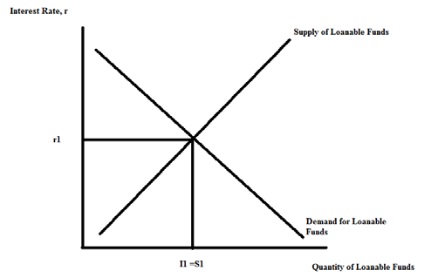
Alter the above graph to represent the following scenario. Suppose that this government runs a surplus. Illustrate this surplus in the above graph. Label the new level of private investment as I2, the new level of household saving as S2, and the new equilibrium interest rate as r2. Make sure you label clearly any curves that shift.
Problem 2. Suppose that in an economy there are 10,000 people who are at least sixteen years old. O f these 10,000 people 5,5 00 are employed; while 2,000 are currently not working, are available for work, and are actively seeking employment by applying for jobs. Of the remaining 2,5 00 people in this population there are 1,000 people who are not working, are available to work, but who are not actively seeking work because they believe that the economy is performing so poorly that there are not jobs available for them; there are also 500 people who are currently working in part - time jobs but who would prefe r to work in full - time jobs but they are not able to find these full - time jobs; and the remaining 1,0 00 people in this population are either full - time students or retirees.
a. Using the standard definition of u nemployment (U - 3), calculate the unemployment rate for this population. Show any formulas you use to calculate this measure.
b. Suppose that the government reclassifies people who are discouraged workers as unemployed workers at the same time that they also decide to coun t as unemployed any workers who are working part - time while preferring to work full - time. Calculate the unemployment rate for this population based on these new definitions of the unemployed. Show your work. Round your answer to the nearest whole percentag e.
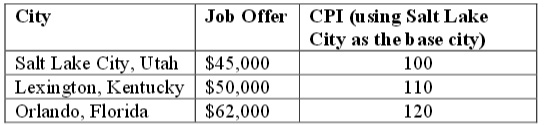
Problem 3. Suzanne is considering three job offers for next year. These three offers are in three different cities and Suzanne wants to take the job that offers the greatest purchasing power. Suzanne rates the three jobs as equivalent, so she will accep t the offer that provides her with the highest real income. Here are the offers as well as data that Suzanne has gathered about the CPI in each of the three cities. Using this data explain which job offer Suzanne should take.
Problem 4. Consider an economy's aggregate production function. In the space below illustrate what happens to this aggregate production function if there is an increase in human capital.
a. In your graph represent the quantity of labor on the horizonta l axis and real GDP on the vertical axis. Then assume that this economy hires L1 units of labor and that this level of labor usage does not change once the increase in human capital occurs. Illustrate the initial level of real GDP as Y1 and the new level o f GDP once the increase in human capital occurs as Y2.
b. In the space below verbally describe what happens to labor productivity with this increase in human capital. Provide the intuition behind what happens and not just a statement of the direction of change in labor productivity.