PART 1
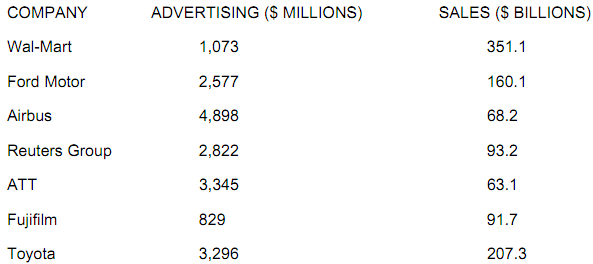
Shown below are the sales revenue and advertising cost data for seven companies published by International Advertising Age.

Use the above data to develop a regression line to predict the amount of advertising by sales. Compute the ‘r2' from the regression output.
Discuss, in at least 150 words, regression models and identify their relative strengths and weaknesses.
PART 2

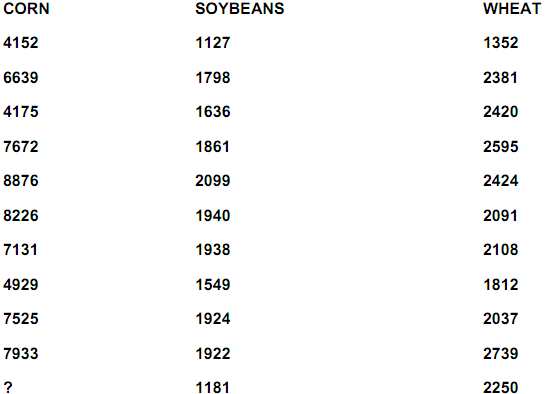
The International Agricultural Producers publishes annual data on various selected farm products. Shown above are the unit productions figures (in millions of bushels) for three farm products for 10 years.
Use this data and multiple regression analysis to predict corn production by the production of soybeans and wheat.
Using 150 words or more comment on the results of your data analysis.