Calculating the GDP from the graph and drawing the business cycle graph.
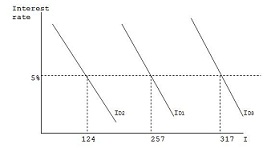
1. If [C0 - (mpc (T) + G + X -IM] = 389 and the multiplier = 8, illustrate what will GDP be for the three investment demand curves shown above?
2. Suppose 1, 2, and 3 represent three consecutive years, and draw a Business Cycle graph for the above hypothetical example.