Solve the following problem:
Q1: Determine if this is an example of probability or statistics:
If a red, blue, and green M&M are placed into a bag, we have a 1/3 chance of reaching in and selecting the red M&M.
Q2: Determine if this data is qualitative or quantitative:
Waist size
Determine if this study is experimental or observational:
Scientists compared the mating habits of two types of frogs in the region.
Q3: Construct a grouped frequency distribution for the data given below:
38 28 37 40 37 29 39 31 38 32
41 39 40 33 28 29 37 42 31 28
Determine if this is an example of a variable or a parameter: SAT score
Determine if this statistical study is descriptive or inferential:
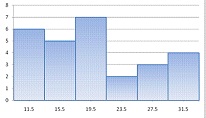
Q4: A study finds that 18% of consumers prefer brand A to brand B. Given the class midpoints in the histogram below, create the corresponding grouped frequency distribution:
Identify the sampling technique used to obtain this sample:
Q5: A group of 240 adults are given numbers from 1-40. A ball is thrown onto a roulette wheel; those people with numbers matching the pocket in which the ball stops are selected for jury duty.
In your own line of work, give one example of a discrete and one example of a continuous random variable, and describe why each is continuous or discrete