Assignment:
For each exercise, determine the
a. rejection region
b. nonrejectoin region
c. critical value (s)
d. significance level
e. Identify the hypothesis test as two tailed, left tailed, or right tailed.
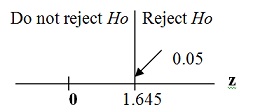
Q1 A graphical display of the decision criterion is:

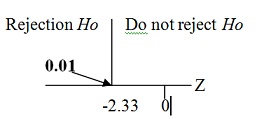
A graphical display of the decision criterion is:

Preliminary data analyses indicate that applying the z-test is reasonable. Comment on the practical significance of all hypothesis tests whose results are statistically significant.
Q2 The mean length of imprisonment for motor-vehicle theft offenders in Australia is 16.7 months. One hundred randomly selected motor-vehicle theft offenders in Sydney, Australia, had a mean length of imprisonment of 17.8 months. At the 5% significance level, do the data provide sufficient evidence to conclude that the mean length of imprisonment for motor-vehicle theft offenders in Sydney differs from the national mean in Australia? Assume that the population standard deviation of the lengths of imprisonment for motor-vehicle theft offenders in Sydney is 6.0 months.
Q3 In 2000, the average car in the US was driven 11.9 thousand miles, as reported by the US Federal Highway Administration in Highway Statistics. A random sample of 500 cars revealed a mean of 11.7 thousand miles driven for last year. Let m denote last year's mean distance driven for all cars.
a. Perform the hypothesis test
Ho m equal 11.9 thousand miles
Ha m does not equal 11.9 thousand miles
At the 5% significance level. Assume that all year's standard deviation of distances driven for all cars is 6.0 thousand miles.
b. Find the 95% confidence interval for m.
c. Does the value of 11.9 thousand miles, hypothesized for the mean m, in the null hypothesis of part (a) lie within your confidence interval from part (b).
Q4 Explain how the P-value is obtained for one-sample z-test in case the hypothesis test is
a. left tailed
b. right tailed
c. two tailed