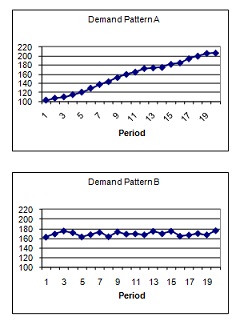
Discuss the below:
Q1: Examine these two graphs and based on the demand pattern and axis scaling, recommend a forecasting technique (and the required parameters) that would work best for each one. Justify your recommendations.

Q2: Develop forecasts for periods 7 through 10 for the demand data in the table using a three period moving average, a weighted moving average using 0.6, 0.3, and 0.1, and exponential smoothing with alpha = 0.7. Use a 6th period forecast of 135 as the starting point for the exponential smoothing technique.
|
Period
|
Actual
|
MA n=3
|
WMA
|
Exp. Smoothing
|
|
1
|
64
|
|
|
|
|
2
|
84
|
|
|
|
|
3
|
91
|
|
|
|
|
4
|
97
|
|
|
|
|
5
|
115
|
|
|
|
|
6
|
135
|
|
|
|
|
7
|
137
|
|
|
|
|
8
|
144
|
|
|
|
|
9
|
153
|
|
|
|
|
10
|
171
|
|
|
|