Assignment:
Question 1
The following graph represents the situation of Sindbad's caps, a firm selling caps in the perfectly competitive caps industry.
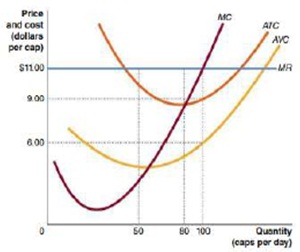
1) How much output should Sindbad produce to maximize his profit, if the market price is equal to $11?
2) How much profit (loss) will he earn?
3) Indicate the profit (loss) area on the graph.
4) Suppose Sindbad decides to shut down. What would his loss be?
Question 2
John produces table lamps in the perfectly competitive desk lamp market.
1) Fill in the missing values in the following table:
|
Output per week
|
Total Cost
|
AFC
|
AVC
|
ATC
|
MC
|
|
0
|
$100
|
|
|
|
|
|
1
|
150
|
|
|
|
|
|
2
|
175
|
|
|
|
|
|
3
|
190
|
|
|
|
|
|
4
|
210
|
|
|
|
|
|
5
|
240
|
|
|
|
|
|
6
|
280
|
|
|
|
|
|
7
|
330
|
|
|
|
|
|
8
|
390
|
|
|
|
|
|
9
|
460
|
|
|
|
|
|
10
|
540
|
|
|
|
|
2) Suppose the equilibrium price in the desk lamp market is $30. How many table lamps should John produce? How much profit will he make?
3) If next week the equilibrium price of desk lamps drops to $15, should John shut down? Explain.