Question: (Anderson, Sweeney, and Williams, 11th ed, 9.4)
Since of high production-changeover time and costs, a director of manufacturing must convince management that a proposed manufacturing technique reduces costs before the new technique can be implemented. The current production technique operates with a mean cost of $220 per hour. A research study will measure the cost of the latest method over a sample production period.
a) Develop the null and alternative hypotheses most suitable for this study.
b) Comment on the conclusion when H0 can’t be rejected.
c) Comment on the conclusion when H0 can be rejected.
Question: (Anderson, Sweeney, and Williams, 11th ed, 9.8)
Assume that a new production technique will be implemented if a hypothesis test supports the conclusion that the new method decreases the mean operating cost per hour.
a) State the suitable null and alternative hypotheses if the mean cost for the current production technique is $220 per hour.
b) What is the Type I error in this situation? What are the effects of making this error?
c) What is the Type II error in this situation? What are the effects of making this error?
Question: (Anderson, Sweeney, and Williams, 11th ed, 9.20)
For United States, the mean monthly Internet bill is $32.79 per household (CNBC, January 18, 2006). The sample of 50 households in a southern state showed a sample mean of $30.63. Use a population standard deviation of = $5:60:
a) Formulate hypotheses for a test to find out whether the sample data support the conclusion that the mean monthly Internet bill in the southern state is less than the national mean of $32.79.
b) Determine the value of the test statistic?
c) What is p-value?
d) At α = .01, what is your conclusion?
Question: (Anderson, Sweeney, and Williams, 11th ed, 9.34)
Joans Nursery specializes in custom-designed landscaping for residential areas. The estimated labor cost related with a particular landscaping proposal is based on the number of plantings of trees, shrubs and so forth to be used for the project. For cost-estimating purposes, managers use 2 hours of labor time for the planting of a medium-sized tree. Actual times from a sample of 10 plantings during the past month follow (times in hours).
1.7, 1.5, 2.6, 2.2, 2.4, 2.3, 2.6, 3.0, 1.4, 2.3
With a .05 level of significance, test to see whether the mean tree-planting time differs from two hours.
a) State the null and alternative hypotheses.
b) Calculate the sample mean.
c) Calculate the sample standard deviation.
d) Determine the p-value?
e) What is your conclusion?
Question: (Anderson, Sweeney, and Williams, 11th ed, 9.45)
Many investors and financial analysts believe the Dow Jones Industrial Average (DJIA) offers a good barometer of the overall stock market. On January 31, 2006, 9 of the 30 stocks making up the DJIA increased in price (The Wall Street Journal, February 1, 2006). On the basis of this fact, a financial analyst claims we can suppose that 30% of the stocks traded on the New York Stock Exchange (NYSE) went up the same day.
a) Formulate null and alternative hypotheses to test the analysts claim.
b) The sample of 50 stocks traded on the NYSE that day showed that 24 went up. What is your point estimate of the population proportion of stocks that went up?
c) Conduct your hypothesis test using α = .01 as the level of significance. What is your conclusion?
Question: (Anderson, Sweeney, and Williams, 11th ed, 10.8)
Will improving customer service result in higher stock prices for the companies providing the better service? When a company’s satisfaction score has enhanced over the prior year’s results and is above the national average (currently 75.7), studies show its shares have a good chance of out-performing the broad stock market in the long run (Business- Week, March 2, 2009). The following satisfaction scores of three companies for the 4th quarters of 2007 and 2008 were obtained from the American Customer Satisfaction Index. Suppose that the scores are based on a poll of 60 customers from each company. Since the polling has been done for several years, the standard deviation can be supposed to equal 6 points in each case.
Company 2007 Score 2008 Score
Rite Aid 73 76
Expedia 75 77
J.C. Penney 77 78
a) For Rite Aid, is the increase in the satisfaction score from 2007 to 2008 statistically significant?
Use α = .05. What can you conclude?
b) Can you conclude that the 2008 score for Rite Aid is above the national average of 75.7? Use α = .05
c) For Expedia, is the increase from 2007 to 2008 statistically significant? Use α = .05
d) When conducting a hypothesis test with the values provided for the standard deviation, sample size, and, how large must the increase from 2007 to 2008 be for it to be statistically important?
e) Use the result of part (d) to state whether the increase for J.C. Penney from 2007 to 2008 is statistically important.
Question: (Anderson, Sweeney, and Williams, 11th ed, 10.17)
Periodically, Merrill Lynch customers are asked to evaluate Merrill Lynch financial consultants and services. The higher ratings on the client satisfaction survey point out better service, with 7 the maximum service rating. Independent samples of service ratings for two financial consultants are summarized here. The consultant A has 10 years of experience, while consultant B has 1 year of experience. Use α = .05 and test to see whether the consultant with more experience has the higher population mean service rating.
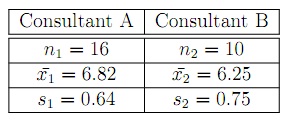
a) Define the null and alternative hypotheses.
b) Calculate the value of the test statistic.
c) Determine the p-value?
d) What is your conclusion?
Question: (Anderson, Sweeney, and Williams, 11th ed, 10.27)
The manufacturer produces both a deluxe and a standard model of an automatic sander designed for home use. Selling prices obtained from a sample of retail outlets follow.
Retail Outlet Deluxe Standard
1 39 27
2 39 28
3 45 35
4 38 30
5 40 30
6 39 34
7 35 29
a) The manufacturer’s suggested retail prices for the two models show a $10 price differential. Use α = .05 level of significance and test that the mean difference between the prices of the two models is $10.
b) What is the 95% confidence interval for the difference among the mean prices of the two models?