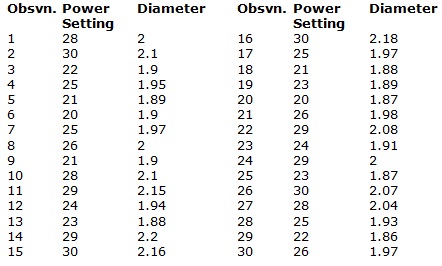
Task: Generate a Scatter Diagram from the given data and information:
Use the following data to generate a Scatter Diagram to show the possible relationship between Power Setting and Diameter in a drilling operation. You can do this by hand and put it into a diagram in word, or you can use Excel. If you use Excel, follow the example in the Example Spreadsheet.

Assignment: Create the diagram as indicated above.