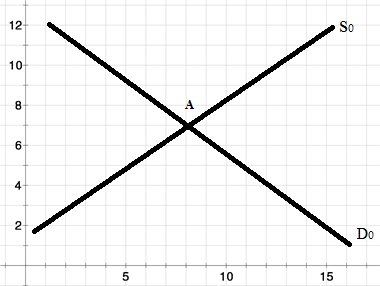
The following graph will represent U.S. dollars on the y-axis and lbs. on the x-axis.
Good X

Good Y
1) Refer to the figure above. Calculate the price elasticity of Good X when prices for consumers decrease by $3.00 in the Good X market leading to a 3 lb. decrease in Good Y.
A) EpD = 0.73
B) EpS = 1.38
C) EpD = 1.38
D) EpS = 0.73
2) From number 31, the Good X market is experiencing a market failure. What is happening in Good X?
A) There is a shortage
B) There is a surplus
C) Consumers consume more
D) Producers produce less
3) From number 32, calculate the price elasticity of Good Y.
A) EpD = 0.72
B) EpS = 1.39
C) EpD = 1.39
D) EpS = 0.72
4) From number 33, calculate the cross-price elasticity.
A) EpXY = 0.72
B) EpXY = 1.20
C) EpXY = 1.39
D) EpXY = 0.84
5) From number 34, what is the relationship between Good X and Y?
A) Compliments
B) Normal
C) Substitutes
D) Inferior