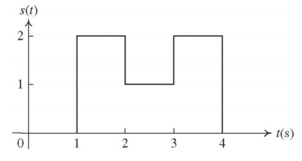
1. Use the Fourier transform of a rectangular pulse (already established in the class) and apply the linear and time-shifting properties of the Fourier transform to obtain the Fourier transform for the signal s(t) shown in Figure.

2. Find the Fourier transform of a train of triangular pulses denoted by:
x(t) = Σn=-∞ ∞ Λ[(t-nTo)/τ],
where Λ(t/τ) is a triangular function with height of 1, width 2τ < T0 and centered around the origin.
3. Consider two random variables, X and Y with the probability density functions (pdfs) given as in Figure. Find the mean and variance of X and Y .

4. The input noise x(t) applied to the filter in Figure is modeled as a wide-sense stationary (WSS), white, Gaussian random process with a zero mean and two-sided PSD N0/2. Let y(t) denote the random process at the output of the filter.

(a) Find and sketch the power spectral density of y(t).
(b) Find and sketch the autocorrelation function of y(t).
(c) What are the average DC level and the average power of y(t)?
(d) Suppose that the output noise is sampled every Ts seconds to obtain the noise samples y(kTs), k = 0, 1, 2, . . .. Find the smallest values of Ts so that the noise samples are statistically independent. Explain.
5. In a double sideband amplitude modulation (DSB AM) system, the carrier is c(t) = A cos 2πfct and the message signal is given by m(t) = sinc(t) + sinc2t. Find the frequency domain representation and the bandwidth of the modulated signal.
6. A frequency-modulated (FM) signal has the form
u(t) = 100 cos [2πfct + 4 sin 2πfmt]
where fc = 10MHz and fm = 1000Hz.
(a) Determine the modulation index and the transmitted signal bandwidth.
(b) Repeat part (a) if fm is doubled.
7. In flat-top sampling, the sampling is done by sampling x(t) at nTs and holding the result until the time of the next sample (n + 1)Ts. Flat-top sampling can be considered as a cascade of impulse-sampling with the following filter:
h(t) = Π[{t-(Ts/2)}/Ts]
What is the filter that you would use to reconstruct the original signal x(t)?
8. Your USB drive has a capacity of 109 bytes (1 gigabyte). You wish to store a digital representation of an information source on the drive. Using a straightforward PCM representation, determine the maximum recording duration for each of the following sources:
(a) 4 kilohertz speech signal, with eight bits per sample.
(b) 22 kilohertz stereo audio signal, with 16 bits per sample in each stereo channel.
(c) 5 megahertz video signal, with 12 bits per sample, and combined with the audio signal in (b).
(d) Digital surveillance video signal, with 1024 × 768 pixels per frame, eight bits per pixel, and one frame per second.
9. Consider the following two signals that are time-limited to [0, Tb]:
s1(t) = V cos(2πfct),
s2(t) = V cos(2πfct + θ),
where fc = k/(2Tb) and k is an integer.
(a) Find the energies of both signals. Then determine the value of V for which both signals have a unit energy.
(b) Determine the correlation coefficient ρ of the two signals. Recall that:
ρ = 1/√(E1E2) 0∫Tb s1(t)s2(t)dt
(c) Plot ρ as a function of θ over the range 0 ≤ θ ≤ 2π. What is the value of θ that makes the two signals orthogonal?
(d) Verify that the distance between the two signals is d = √2E √1-ρ. What is the value of θ that maximizes the distance between the two signals?
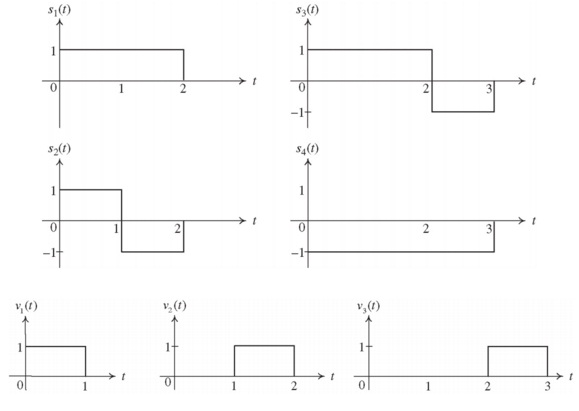
10. Consider the set of four time-limited waveforms shown in Figure 4.
(a) Using the Gram-Schmidt procedure, construct a set of orthonormal basis functions for these waveforms.
(b) By inspection, show that the set of orthonormal functions in Figure can also be used to exactly represent the four signals in Figure
