Assignment:
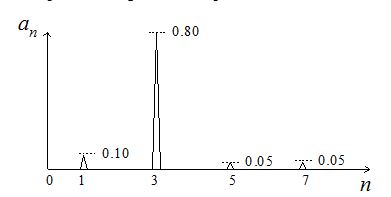
In order to monitor the condition of a heavy duty electric motor, vibration analysis can be performed. Fourier analysis of the vibration of the motor, when new, results in the following spectrum which comprises four significant components:

(a) Explain the relationship between the spectral components indicated above and the corresponding graph showing the motion of the surface of the motor plotted as a function of time. What do they represent?
(b) Given the amplitudes indicated in the above diagram, copy and complete the table below for the amplitude of the vibration in the time domain. Sketch the result of your reconstructed waveform in the period 0 < t < 0.1 ms, assuming
f0 = 5000 Hz.
|
n
|
an
|
T = 0
|
T = 0.025s
|
T = 0.05s
|
t=0.075s
|
T = 0.1s
|
|
1
|
0.10
|
0.10
|
|
|
|
|
|
3
|
0.80
|
|
-0.57
|
|
|
|
|
5
|
0.05
|
|
|
0.00
|
|
|
|
7
|
0.05
|
|
|
|
-0.04
|
|
|
Totals
|
-
|
|
|
|
|
-1.00
|
Provide complete and step by step solution for the question and show calculations and use formulas.