Question 1a
Consider the transportation problem having the following data.
DESTINATION
|
|
1
|
2
|
3
|
Supply
|
|
Source
|
|
|
|
|
|
1
|
6
|
7
|
4
|
40
|
|
2
|
5
|
8
|
6
|
60
|
|
Demand
|
30
|
40
|
30
|
|
- formulate a network model for this problem as a minimum-cost flow problem by drawing a network model.
- Formulate and solve a spreadsheet model for this problem.
NOTE: using word, insert shapes, lines with arrow draw answer to "a"
Type your name and label drawings.
Using solver and excel for "b" total cost should be $580
Question 1b
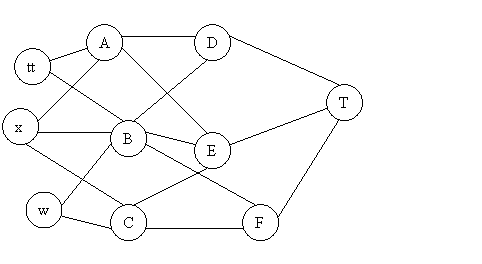
The diagram below depicts a system of aqueducts that originate at three rivers (nodes tt, x, and w) and terminate at a major city (node T), where the other nodes are junction points in the system.

Using units of thousands of acre feet , the following tables show the maximum amount of water that can be pumped through each aqueduct per day.
|
To/ From
|
A
|
B
|
C
|
|
tt
|
75
|
65
|
-
|
|
x
|
40
|
50
|
60
|
|
w
|
-
|
80
|
70
|
|
To/From
|
D
|
E
|
F
|
|
To/From
|
|
|
A
|
60
|
45
|
-
|
|
D
|
120
|
|
B
|
70
|
55
|
45
|
|
E
|
190
|
|
C
|
-
|
70
|
90
|
|
F
|
130
|
- formulate this problem as a maximum flow problem by identifying a source, a sink, and transshipment nodes, and then drawing the complete network that shows the capacity of each arc.