Assignment:
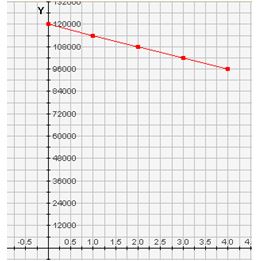
Q1. The following graph shows how a 4-color web printing press depreciates from the year 2006 to the year 2010. It was purchased new in the year 2006; therefore x = 0 represents the year 2006.
X – axis (horizontal) = years starting from 0 = 2006 and increasing by 0.5 years
Y – axis (vertical) = price in $ amounts

a) List the coordinates of any two points on the graph in (x, y) form.
(___, ___),(___, ___)
b) Find the slope of this line:
c) Find the equation of this line in slope-intercept form.
d) If trend for the depreciation of the press continued, what would be its value in the year 2015? Show how you obtained your answer using the equation you found in part c).
Q2. Suppose that the length of a rectangle is three cm longer than twice the width and that the perimeter of the rectangle is 90 cm.
a) Set up an equation for the perimeter involving only W, the width of the rectangle.
b) Solve this equation algebraically to find the length of the rectangle. Find the width as well.
Q3) A temporary agency offers two payment options for administrative help:
Option1: $25 daily fee plus $10/hour; or
Option 2: No daily fee but $15/hour.
Let x = total hours worked.
a) Write a mathematical model representing the total temp cost, C, for a four-day temporary administrative assistant in terms of x for the following:
Option 1: C=_________________
Option 2: C=_________________
b) How many total hours would the temp need to work in the four day period for the cost of option 1 to be less than option 2. Set up an inequality and show your work algebraically using the information in part a. Don’t forget about the daily fee in Option 1 (it’s a four day proposition!). Do not assume an eight our workday. Any number of hours per day is possible.
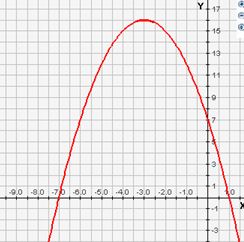
Q4) Use the graph of y = 7 – 6x – x2 to answer the following:

a) Without solving the equation (or factoring), determine the solutions to the equation 7 – 6x – x2 = 0 using only the graph.
Explain how you obtain your answer(s) by looking at the graph:
b) Does this function have a maximum or a minimum?
Explain how you obtain your answer by looking at the graph:
c) What is the equation of the line (axis) of symmetry for this graph?
d) What are the coordinates of the vertex in (x, y) form?
Q5) The profit function for the Recklus Hang gliding Service is P(x) = -0.4x2 + fx - m, where f represents the set up fee for a customer’s daily excursion and m represents the monthly hanger rental. Also, P represents the monthly profit in dollars of the small business where x is the number of flight excursions facilitated in that month.
a) If $40 is charged for a set up fee, and the monthly hanger rental is $800; write an equation for the profit, P, in terms of x.
Typing hint: Type x-squared as x^2
b) How much is the profit when 30 flight excursions are sold in a month?
c) How many flight excursions must be sold in order to maximize the profit? Show your work algebraically. Trial and error is not an appropriate method of solution – use methods taught in class.
d) What is the maximum profit?
Q6) Graph the equations on the same graph by completing the tables and plotting the points. You may use Excel or another web-based graphing utility.
a) y = 2x - 5
Use the table; find at least 3 points using any values for x.
b) y = 3x - x2
Use the values of x provided in the table.
Provide complete and step by step solution for the question and show calculations and use formulas.